
FIG 6 .
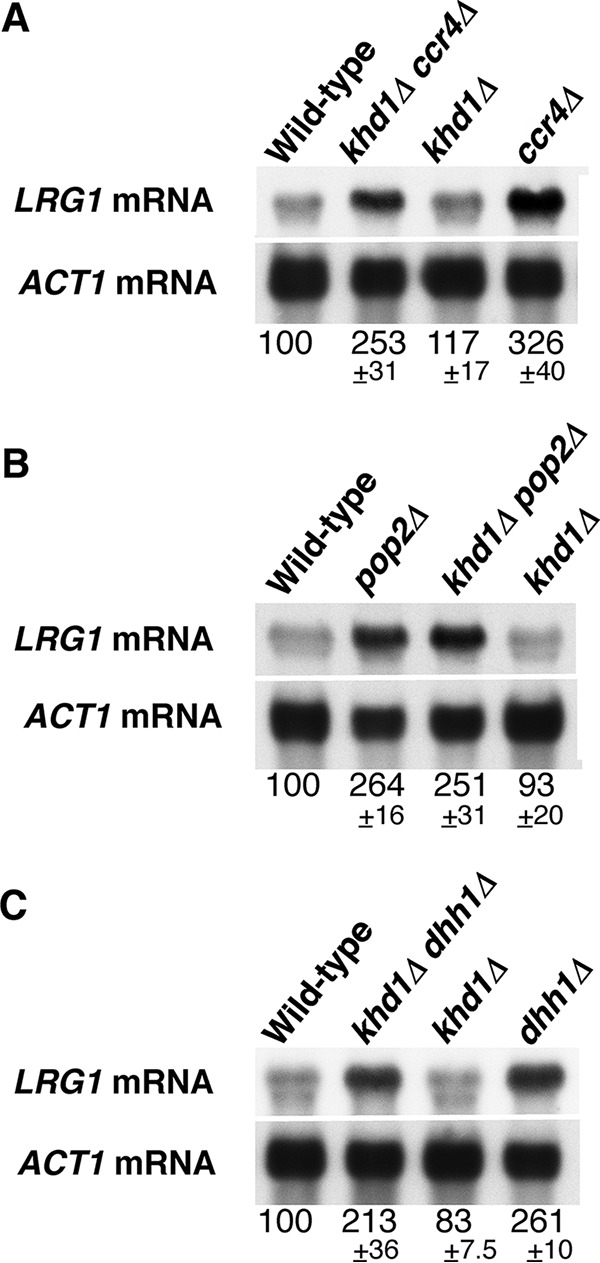
LRG1 mRNA levels in the khd1Δ ccr4Δ, khd1Δ pop2Δ, and khd1Δ dhh1Δ mutant strains. (A) LRG1 mRNA levels in wild-type, khd1Δ ccr4Δ, khd1Δ, and ccr4Δ cells. Wild-type (c1H-1A), khd1Δ ccr4Δ (c1H-1B), khd1Δ (c1H-1C), and ccr4Δ (c1H-1D) cells were cultured to mid-logarithmic phase in YPD medium and collected, and total RNA was prepared. The LRG1 transcripts were quantified by Northern blotting as described in Materials and Methods. ACT1 mRNA was included as a quantity control. The mRNA levels are indicated as percentages of wild-type levels and represent the means ± standard deviations from three independent experiments. The bands smaller than the LRG1 mRNA bands show cross hybridization to rRNA. (B) LRG1 mRNA levels in wild-type, pop2Δ, khd1Δ pop2Δ, and khd1Δ cells. Wild-type (p1H-2A), pop2Δ (p1H-2B), khd1Δ pop2Δ (p1H-2C), and khd1Δ (p1H-2D) cells were cultured to mid-logarithmic phase in YPD medium and collected, and total RNA was prepared. (C) LRG1 mRNA levels in wild-type, khd1Δ dhh1Δ, khd1Δ, and dhh1Δ cells. Wild-type (d1H-1A), khd1Δ dhh1Δ (d1H-1B), khd1Δ (d1H-1C), and dhh1Δ (d1H-1D) cells were cultured to mid-logarithmic phase in YPD medium and collected, and total RNA was prepared.