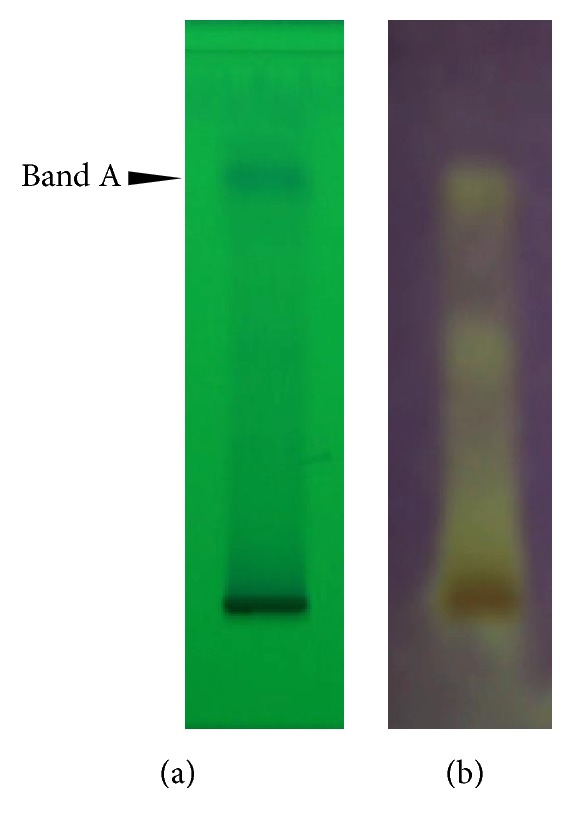
Figure 1.

Separation of ME by TLC and antioxidant properties of its constituents. (a) ME was separated by TLC and visualized under UV at 254 nm. Major compounds appeared in a single band at R f = 0.75 (band A). (b) Screening of antioxidant activity was done by applying DPPH onto the TLC plate. Scavenging of DPPH was shown in yellow staining indicating antioxidative activity of ME.
