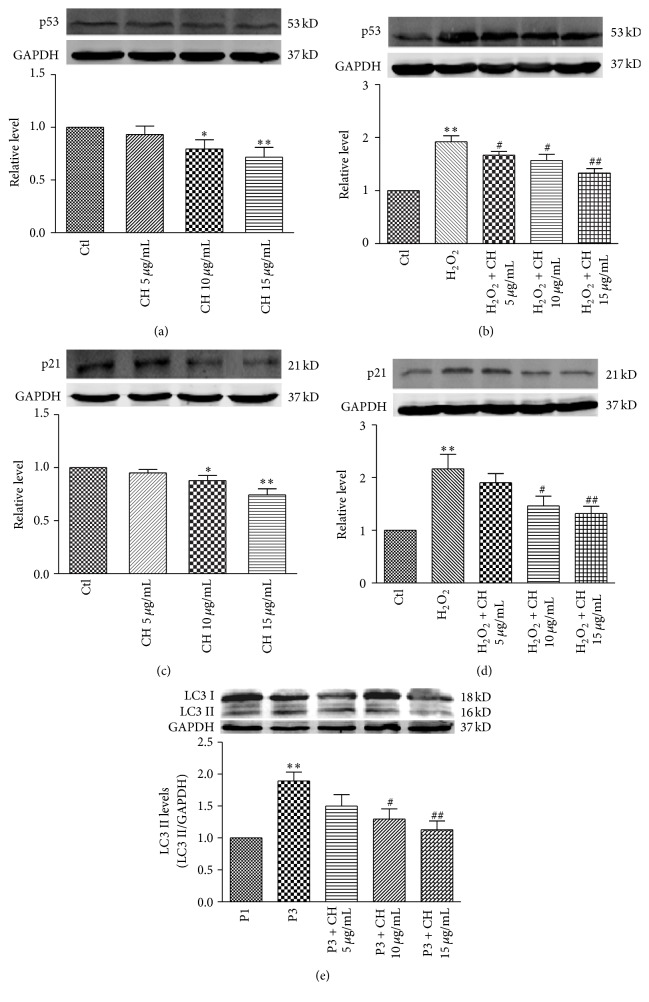
Figure 3.
Effects of CH on expression of p53, p21Cip1/Waf1, and LC3 proteins. (a) and (b), Expression of p53 protein in the P3 or in the P1 with H2O2 (25 μM, 6 h). n = 3 for each group, ∗ P < 0.05, ∗∗ P < 0.01 versus Ctl group; # P < 0.05, ## P < 0.01 versus H2O2 group. (c) and (d) Expression of p21Cip1/Waf1 proteins in the P3 or in the P1 cells treated with H2O2. n = 3 for each group, ∗ P < 0.05, ∗∗ P < 0.01 versus Ctl group; # P < 0.05, ## P < 0.01 versus H2O2 group. (e) Expression of LC3 protein in BMSCs with or without different concentrations of CH. n = 3 for each group, ∗∗ P < 0.01 versus P1 group; # P < 0.05, ## P < 0.01 versus P3.

