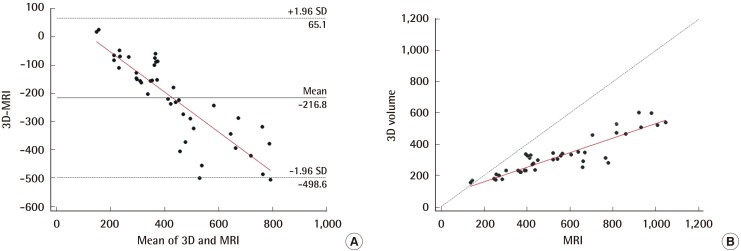
Fig. 4. Comparison of 3D-scanning and MRI-volumetry.
In the Bland-Altman analysis (A), most values lie within the 95% confidence interval and the relationship between the 3D scanning and the water-displacement technique was shown to vary depending on the volume. Using Passing-Bablok regression, the following regression analysis was derived: 3D scan=64.86+(0.47×MRI) (B). We were able to find a linear association and significant difference between the two methods. MRI, magnetic resonance imaging; SD, standard deviation.

