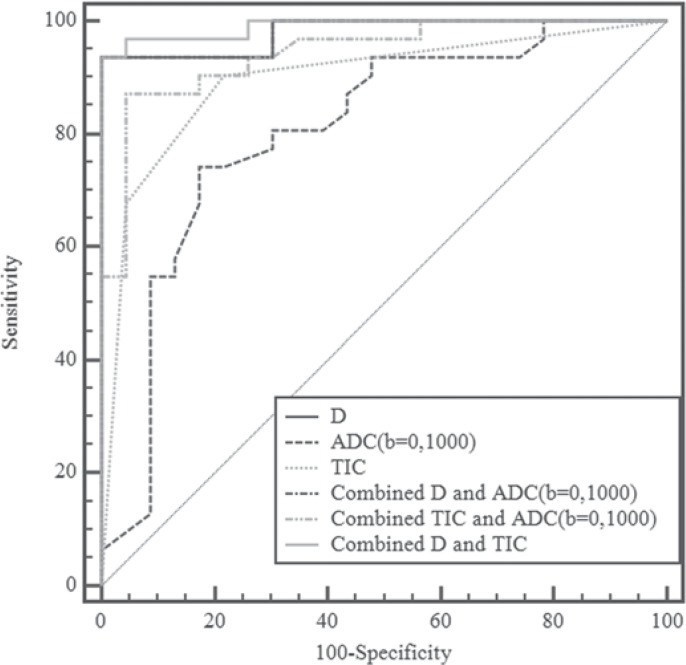
Fig. 3.
Pairwise comparisons in receiver operating characteristic (ROC) curves of tissue diffusivity (D), apparent diffusion coefficient (ADC0,1000), time-signal intensity curve (TIC), and combined models. The graph shows that the model incorporating both D and TIC provided the best discriminative ability. The pairwise comparisons in ROC curves of D, ADC50,800, TIC, and combined models were similar to those of D, ADC0,1000, TIC, and combined models.

