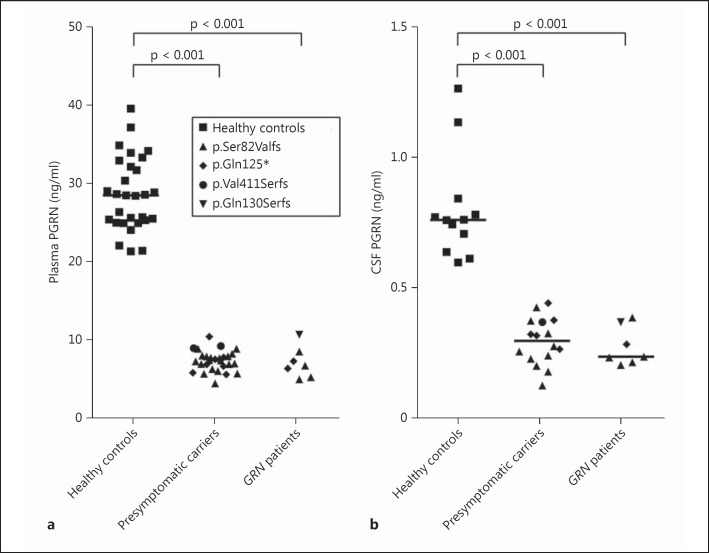
Fig. 1.
PGRN levels in plasma and CSF. PGRN in plasma from healthy controls (n = 29), presymptomatic GRN mutation carriers (n = 28) and GRNpatients (n = 7) (a) and in CSF from healthy controls (n = 12), presymptomatic GRN mutation carriers (n = 16) and GRN patients (n = 7) (b). Each individual is represented as a data point and labeled by type of mutation. Horizontal lines are median plasma levels per group.

