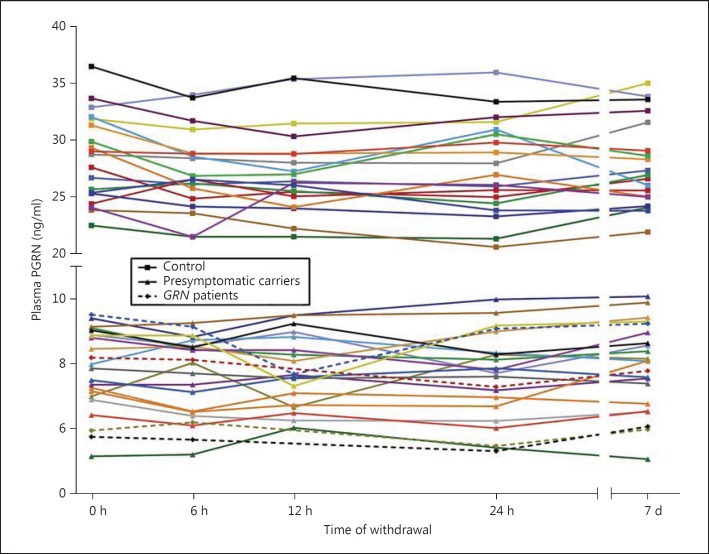
Fig. 4.
Longitudinal plasma PGRN. PGRN levels over time in plasma of healthy controls (n = 19, squares), presymptomatic GRN mutation carriers (n = 18, triangles) and GRN patients (n = 4, diamonds). Each withdrawal is represented with a data point; lines connect data points of each individual. At the 12-hour time point, 3 data points are missing (all GRN patients).

