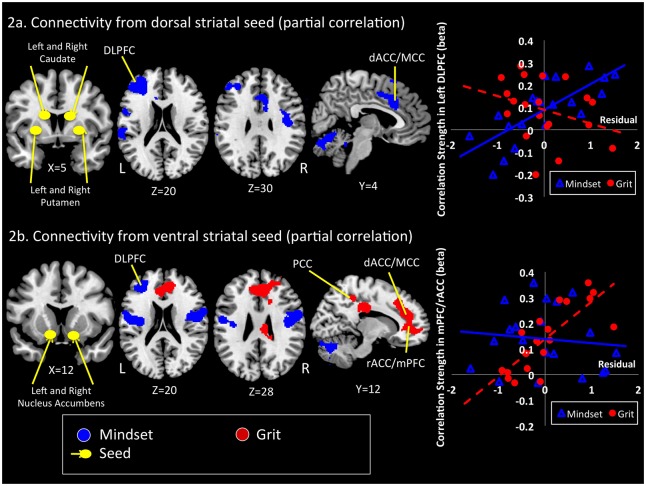
Fig. 2.
Striatal networks of grit and mindset (positive partial correlation). Clusters depicted were significant at P = 0.05 Bonferroni corrected for the number of ROIs and for the whole brain. (A) Resting state functional dorsal striatal connectivity correlation with mindset while regressing out grit (blue). No positive dorsal striatum connectivity with grit while regressing out mindset. Panel on the right is a scatter plot of connectivity strength from dorsal striatal ROI to left dorsolateral prefrontal cortex (DLPFC) plotted against grit (red) and mindset (blue). The left DLPFC cluster is shown on the left panel at z = 20. Grit and mindset are in z scores. (B) Resting state functional ventral striatal connectivity correlation with mindset (blue) and grit (red). Overlapping regions are depicted in purple. Panel on the right is a scatter plot of connectivity strength from ventral striatal ROI to medial prefrontal/rostral anterior cingulate (MPFC/rACC) plotted against grit (red) and mindset (blue). The MPFC/rACC is shown on the left panel at y = 12. Grit and mindset are residualized for the opposite and represented in z scores.

