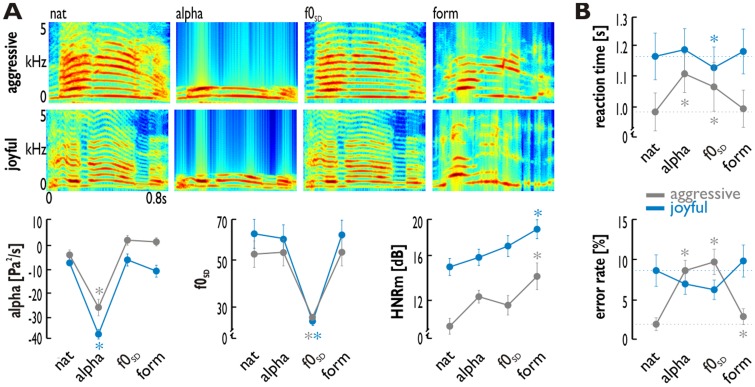
Fig. 1.
Stimulus spectrograms, acoustic features and behavioral data. (A) The experiment included 16 aggressive and 16 joyful voices presented as native voices (‘nat’) or as manipulated voices. Shown are spectrograms (time on the x-axis, frequency on the y-axis) of example stimuli. The latter were created by eliminating one critical acoustic feature, resulting in 1 kHz low-pass filtered stimuli (‘alpha’, defined by the ratio of energy in high, >1 kHz, and low frequency bands, <1 kHz), in voices with reduced variation of the f0 (‘f0SD’), or in formant-filtered voices (‘HNRM’) to increase the HNR level. Low-pass filtering resulted in a significant decrease in the alpha level of the stimuli (left panel); the variation of the f0 was significantly decreased in f0SD manipulated voices (middle panel); and formant-filtered voices had a significantly increased level of the mean HNR (right panel). Asterisks indicate a significant change (P < 0.05; ANOVA post-hoc pairwise comparison) of a specific acoustic feature elimination of manipulated compared to the native vocalizations. (B) Reaction times (upper panel) and percentage error rates (lower panel) for the discrimination task computed on the behavioral data of the 13 participants. Asterisks indicate a significant (P < 0.05; post-hoc paired t-tests) difference for manipulated compared with native voices. Error bars indicate the standard error of the mean (SEM).

