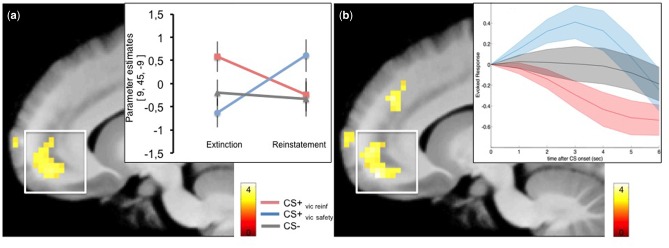
Fig. 5.
(a) Change in vmPFC activity from extinction to reinstatement testing displayed for all CSs separately (b). Mean estimated evoked responses (arbitrary units) within the vmPFC during Reinstatement test scaled to the response at onset of each CS. Shaded areas represent SEM. T-values are superimposed on a normalized average structural image. fMRI display threshold: P < 0.005, uncorrected for illustrative purposes.

