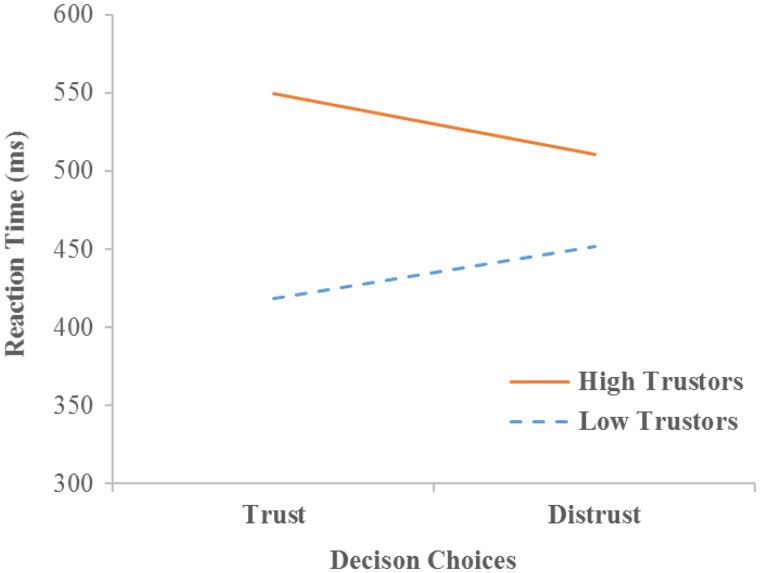
Fig. 3.
Individuals’ trust rates across all trials moderated the linkage between trust choices and reaction time. The simple regression line is plotted in the figure. High trustors are plotted at 1 s.d. above the mean trust rates across all participants (i.e. 81% trust). Low trustors are plotted at 1 s.d. below the mean trust rates (i.e. 51% trust).

