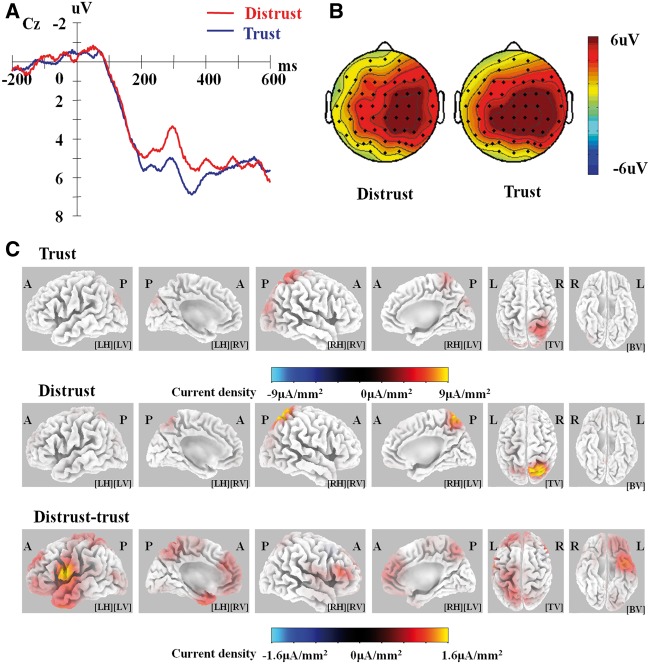
Fig. 4.
Event-related potential at the decision-making phase. (A) Grand average waveforms. (B) Scalp topography for the N2 in the 250–350 ms post-stimulus time window. (C) sLORETA images of the standardized current density maximum for Trust/Distrust and source localization (Distrust minus Trust during 275–325 ms). The results at the peak latency of the N2 (325 ms) are illustrated. A, anterior; P, posterior; R, right; L, left; LH, left hemisphere; RH, right hemisphere; LV, left view; RV, right view; TV, top view; BV, bottom view.

