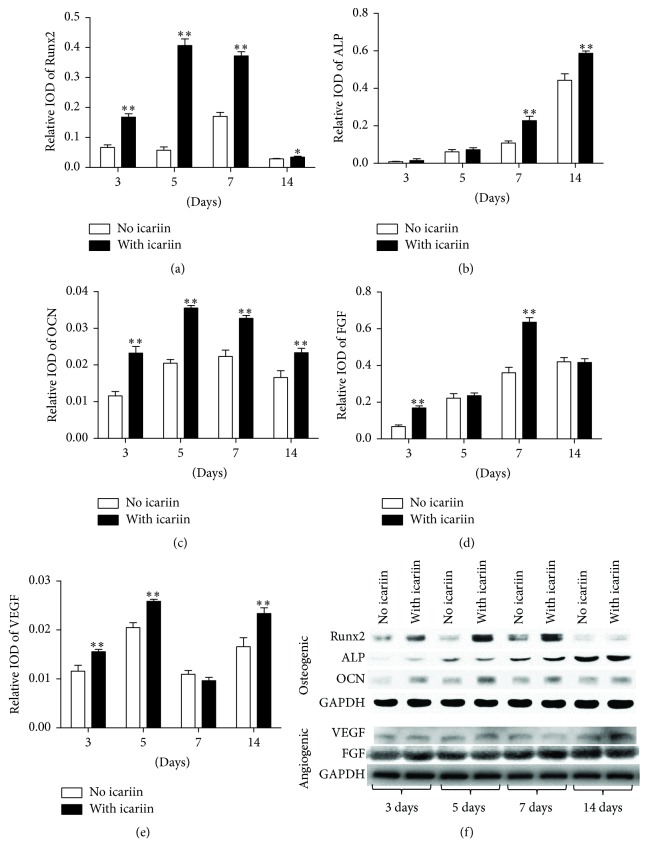
Figure 4.
Graphs depicting the fold changes of the expression of osteogenesis-related and angiogenesis-related proteins in BMSCs under the stimulation of 10−6 mol/L icariin for 3 days, 5 days, 7 days, and 14 days. (a) Runx2, (b) alkaline phosphatase (ALP), (c) osteocalcin (OCN), (d) fibroblast growth factors (FGF), (e) vascular endothelial growth factor (VEGF), and (f) photographs of western blot analysis from a representative experiment. All data are presented as mean values together with the standard deviation (SD). ∗ p < 0.05; ∗∗ p < 0.01 indicating the statistical difference between the experimental group (with icariin) and the control group (no icariin) at the same time point.

