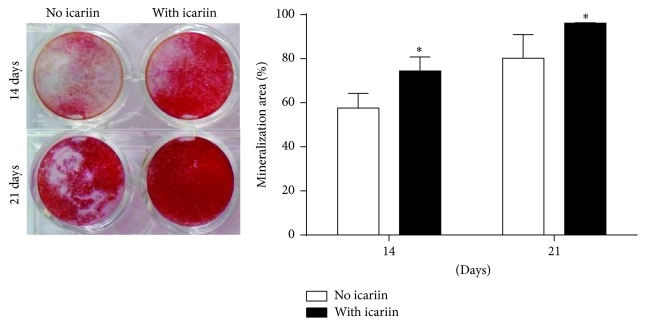
Figure 5.
Mineralization assay of BMSCs with or without the stimulation of 10−6 mol/L icariin for 14 days and 21 days. All data are presented as mean values together with the standard deviation (SD). ∗ p < 0.05 indicating the statistical difference between the experimental group (with icariin) and the control group (no icariin) at the same time point.

