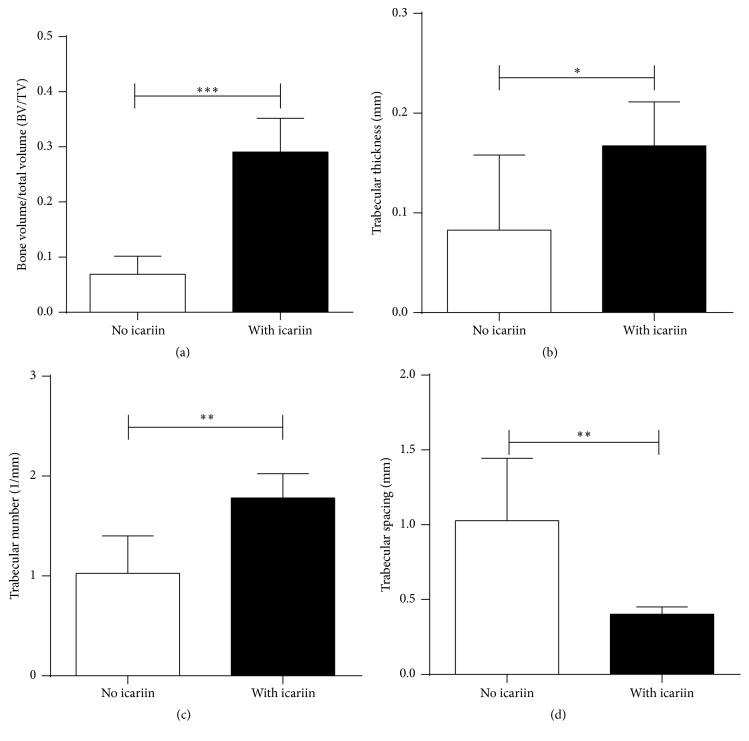
Figure 8.
Graph depicting the micro-CT analysis of the BV/TV (a), Tb.N (b), Tb.Th (c), and Tb.Sp (d) of the newly formed bone within the calvarial critical-size bone defects that were treated with SMC-PHBHHx scaffolds/allogeneic BMSCs either without or with adsorbed icariin. All data are presented as mean values together with the standard deviation (SD). ∗ p < 0.05; ∗∗ p < 0.01; ∗∗∗ p < 0.001.

