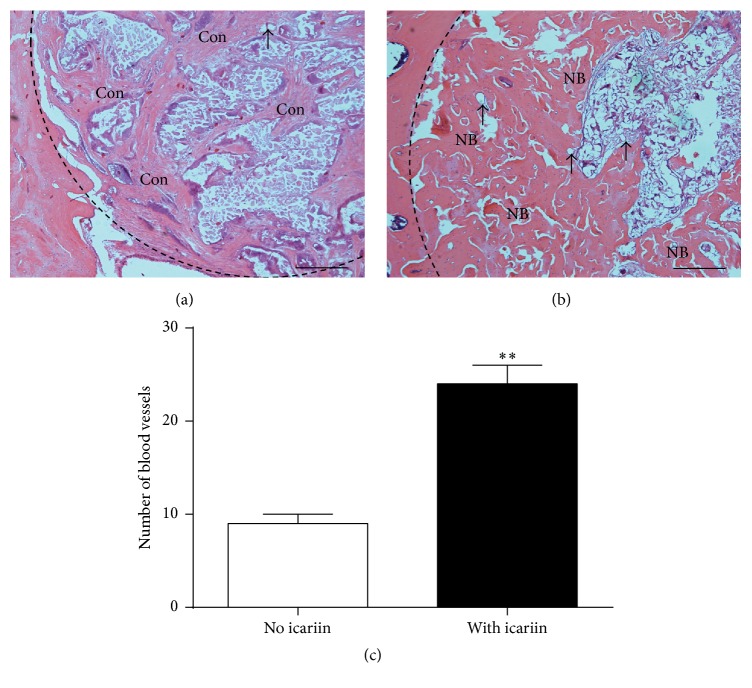
Figure 9.
Light micrographs depicting the new bone formation within the calvarial critical-size bone defects that were treated with SMC-PHBHHx/allogeneic BMSCs either (a) without or (b) with icariin. Bar = 200 μm. Then all data are presented as mean values together with the standard deviation (SD). NB: new bone; Con: connective tissue; black arrow: blood vessels. (c) Graph depicting the number of vessels per section. All data are presented as mean values together with the standard deviation (SD). ∗∗ p < 0.01.

