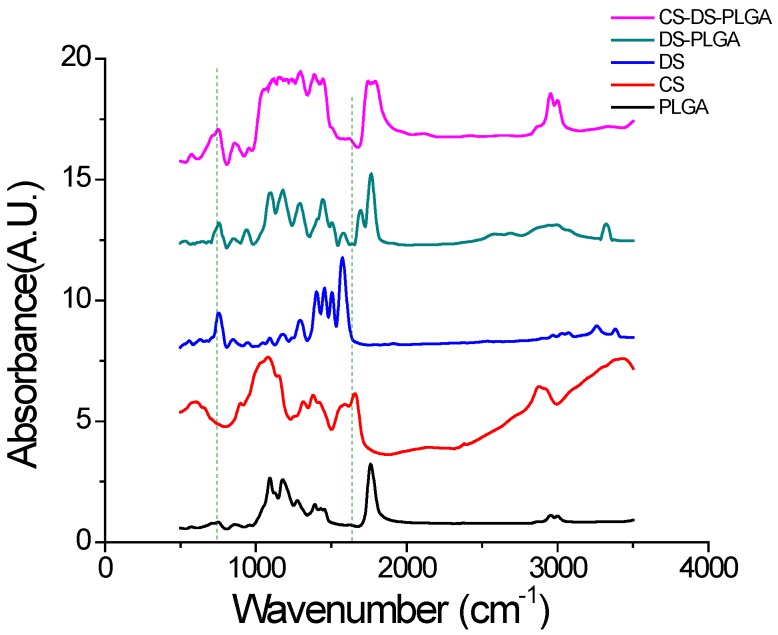
Figure 3.
FTIR spectra of PLGA, CS, DS, DS-PLGA, and CS-DS-PLGA. The major peaks for all nanoparticles samples is measured at 1175 cm−1 and 1760 cm−1 which corresponds to the standard basic measurement of PLGA absorption band. Characteristic absorption peak of chitosan at 1545 cm−1 and 1630 cm−1 and that of drug at 768 cm−1 confirms their presence in respective nanoparticles.

