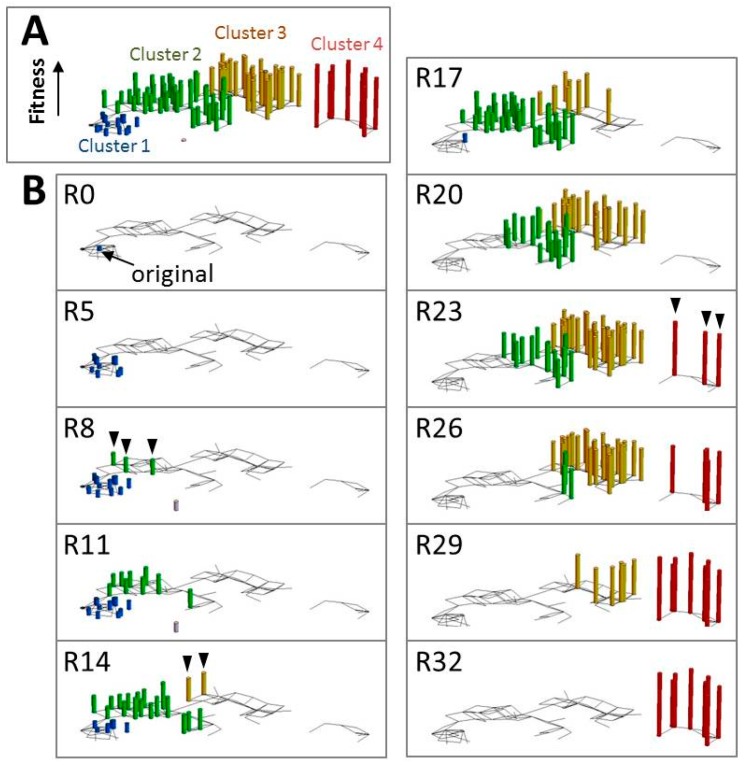
Figure 4.
The evolutionary process of the template RNA in the TcRR system. (A) The template RNA sequences were analyzed over 32 rounds (R1 to R32) of a transfer experiment using the TcRR system. The Hamming distances of 91 major genotypes were calculated and projected on a two-dimensional landscape. The genotypes were classified into four major clusters (Clusters 1 to 4) and colored accordingly. The fitness of each genotype was estimated from the rate of change in its frequency and plotted on the z-axis. (B) Only the genotypes that constituted more than 1% of the population at each round were shown. The RNA population first diverged within Cluster 1 (R0 to R5). Three RNA genotypes that had higher fitness then appeared within Cluster 2 (arrowheads in R8). The RNA population then continued to diverge within Cluster 2 (R8 to R11). Subsequently, two genotypes that had much higher fitness appeared in Cluster 3 (R14, arrowheads). The RNA population again diverged within Cluster 3 (R14 to R20), and three new genotypes appeared in Cluster 4 (R23, arrowheads). Finally, the population diverged within Cluster 4 (R23 to R32). Reproduced with permission from Oxford Journals [52].

