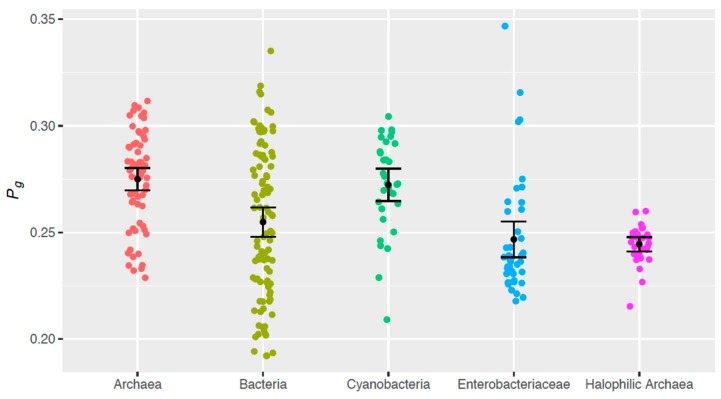
Figure 4.
Distributions of the theoretical genomic photoreactivity Pg computed for samples of (non-halophilic) archaea (n = 68), bacteria (n = 101), cyanobacteria (n = 32), enterobacteriaceae (n = 42), and halophilic archaea (n = 29). Sample means are marked with error bars representing +/− 1.96 standard errors.

