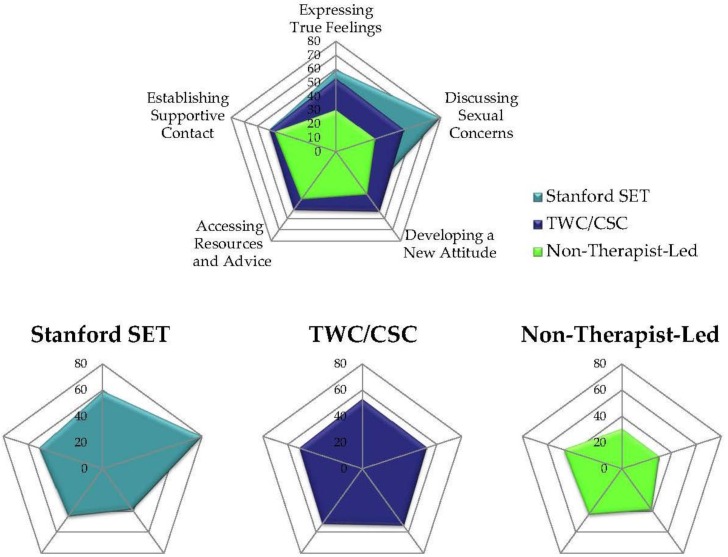
Figure 1.
(Top) Overlapping radar plots of ranked percentile scores (across groups) of which group experiences were most important to participants (Group Experience Questionnaire) in 3 support groups by 5 subscales. Distance from center is level of ranking of importance by participants within each subscale (represented on the axes). Each color represents a different support group format. By examining shape, readers can perceive the constellation of experiences (subscales) most important within each group format. A particular subscale emphasis for a group can be seen where a color prominently extends beyond the colors for other groups outward on the axes; (Bottom) We present a separate radar chart for each group’s shape, since in the overlapping plot on top some points are occluded.

