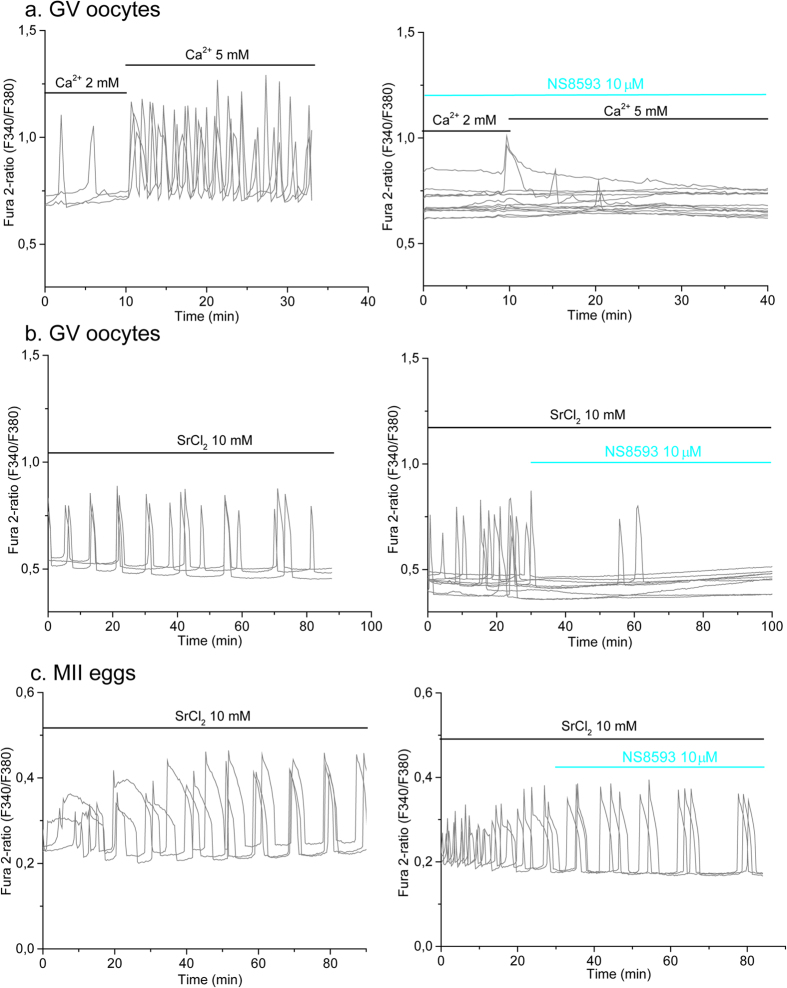
Figure 5. NS8593 blocks [Ca2+]i and Sr2+ induced oscillations in oocytes.
Spontaneous [Ca2+]i oscillations were induced and measured at RT in response to increasing concentrations of extracellular Ca2+ and 10 mM Sr2+ in WT oocytes. (a) Left panel, [Ca2+]i oscillations were evaluated in response to increased extracellular Ca2+ (black horizontal bars). Figure shows representative traces for 3 oocytes. n = 9. Right panel: Oocytes were exposed to 10 μM NS8593 (cyan bar) and Ca2+ oscillations were evaluated after increasing external Ca2+ concentration from 2 or 5 mM (black horizontal bars). n = 13. (b) Left panel: Representative traces for 3 oocytes showing Sr2+-induced oscillations. n = 5, oocytes that show 3 or more oscillations. Right panel: Sr2+-induced oscillations were blocked by exposure to 10 μM NS8593 (cyan bar). n = 9. (c) Oscillations induced by Sr2+ at 33–35 °C (left panel, n = 5. Figure shows representative traces for 3 eggs) are not blocked by 10 μM NS8593 (cyan bar; right panel, n = 7. Figure shows representative traces for 3 eggs).

