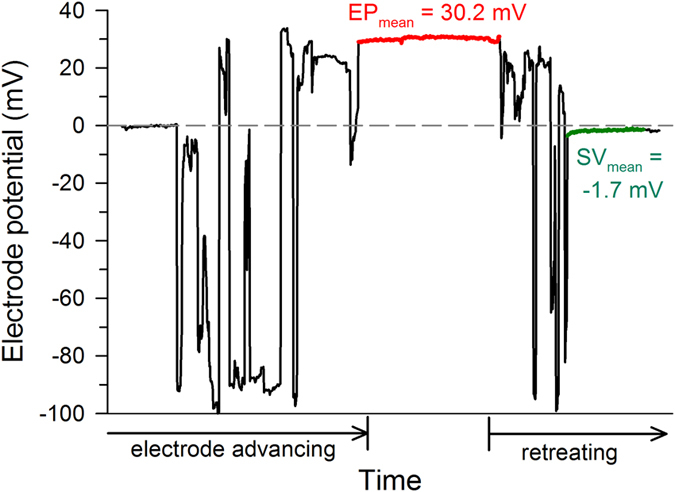
Figure 6. Example of an EP recording from the barn owl.

The recorded potential is shown as a function of time. At the start of recording, the electrode potential was zeroed (dashed reference line) and then advanced in 10 μm steps at irregular intervals. Note that the graph does not show electrode position (depth), but time. Large negative potentials indicated that cells of the tegmentum vasculosum were entered. There were typically several large potential jumps over a distance of several hundred μm before a stable positive potential (here shown in red) could be recorded. Upon reversing the electrode movement, the potential returned to very close to baseline (here shown in green).
