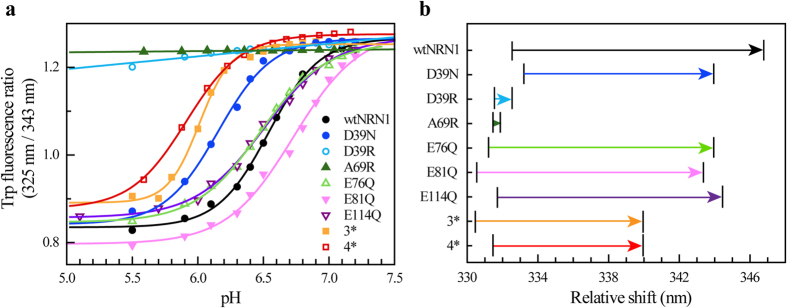
Figure 2. Trp fluorescence analysis of NRN1L.h.variants.
(a) The ratio of fluorescence at 328 nm and 343 nm indicates the proportion between conformation I and II. The lines represent fits based on a two-state model. (b) Shift of the fluorescence maximum upon lowering the pH from 7.2 to 5.5 (see also Supplementary Fig. S5).

