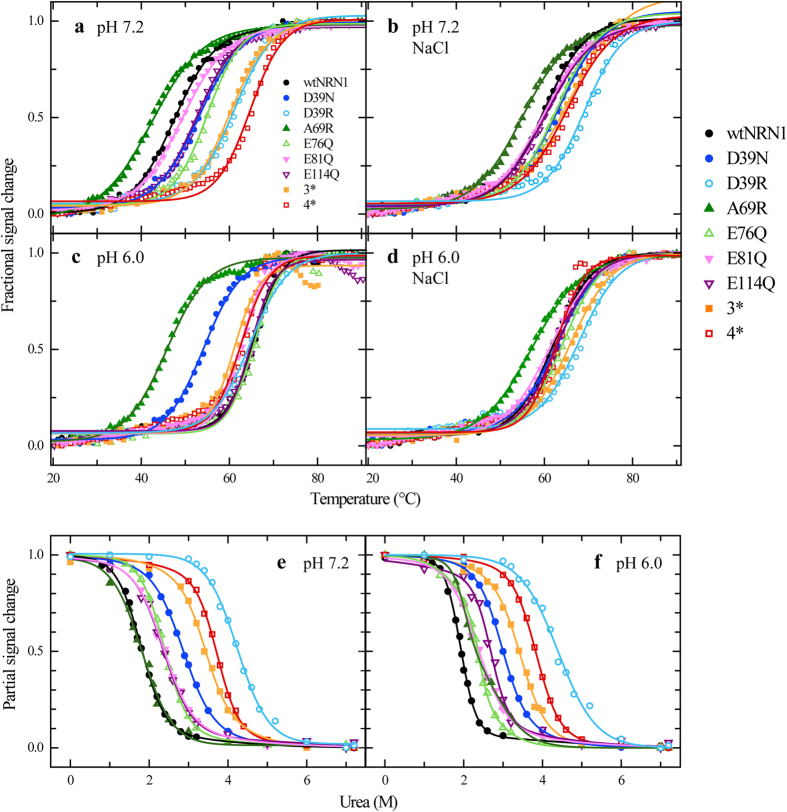
Figure 3. Stability analysis of NRN1L.h.variants.
Protein denaturation was analysed as a function of urea concentration or temperature using CD ellipticity at 222 nm. (a–d) Thermal denaturation of NRN1L.h.variants at (a) pH 7.2, (b) pH 7.2 in the presence of 300 mM NaCl, (c) pH 6.0 and (d) pH 6.0 in the presence of 300 mM NaCl. (e,f) Urea titration of NRN1L.h.variants at (e) pH 7.2 and (f) pH 6.0. The lines represent fits using a two-state model.

