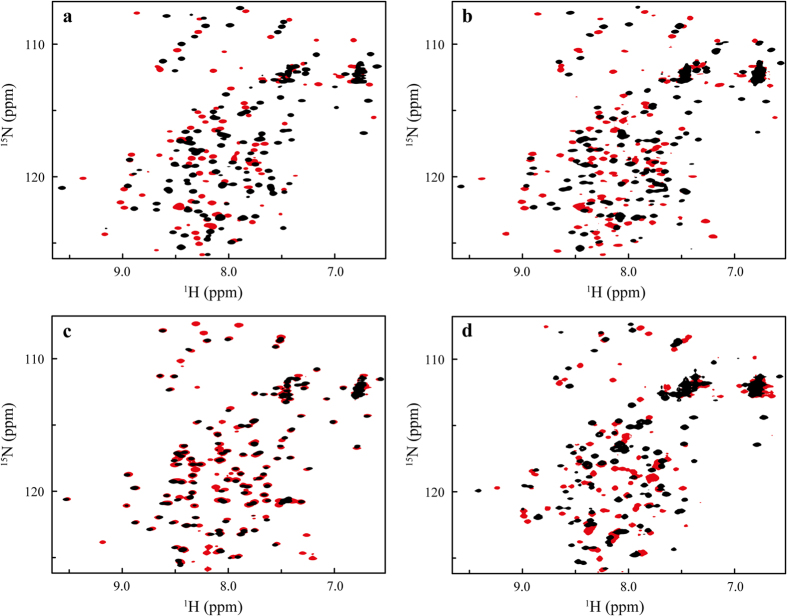
Figure 5. HSQC spectra of wtNRN1L.h., E114Q, D39R and 3*.
15N-HSQC spectra of (a) wtNRN1L.h., (b) E114Q and (c) D39R have been taken at pH 7.2 (black) and pH 6.0 (red). (d) Since the conformational change of 3* was shifted to a lower pH, the 15N-HSQC spectra of 3* was measured at pH 7.2 (black) and at pH 5.5 (red).

