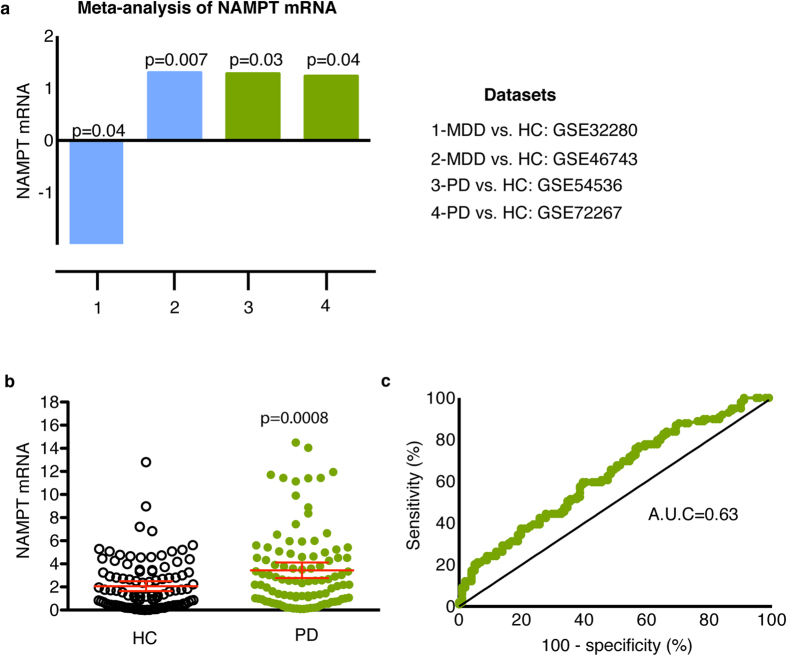
Figure 4. Evaluation of NAMPT mRNA in PD.
(a) Meta-analysis results for NAMPT mRNA across the four PD (green) and MDD (blue) datasets used in this study. NAMPT was significantly upregulated in both datasets from untreated PD patients compared to HC. (b) RT-qPCR assays were used to confirm the results from the meta-analysis. Relative abundance of NAMPT mRNA in blood of 99 PD patients (green) compared to 101 HC (white) in samples obtained from PPMI. The geometric mean of two reference genes, GAPDH and PGK1, were used to normalize for input RNA. A Student t-test (two-tailed) was used to assess the significance between PD and controls. Error bars represent 95% confidence interval. A p-value of 0.05 or less was regarded as significant (c) ROC analysis of NAMPT resulted in an AUC value of 0.63.

