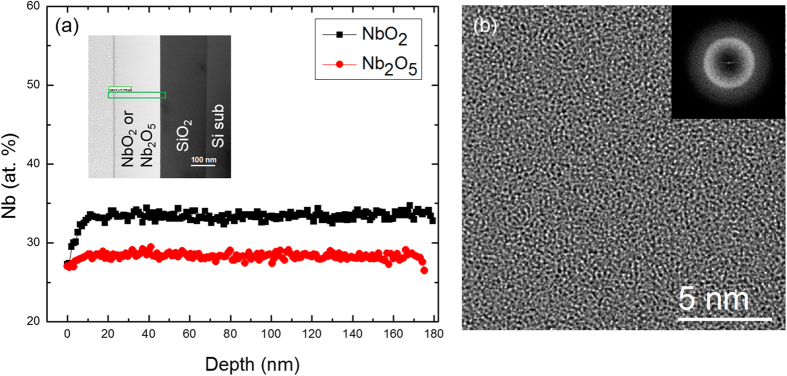
Figure 1.
(a) Compositional profiles across NbO2 and Nb2O5 film (180 nm thick) from quantitative EELS analysis with cross-sectional STEM DF image in the inset. The STEM EELS spectrum image were collected with pixel size of 1 nm across the thin film (as shown in the rectangular area). The quantification were done by subtraction of pre-edge power law background and integrate Nb-M4,5 edge and O-K edge window. (b) HRTEM image of the as-prepared NbO2 film shows the amorphous microstructure and was confirmed by the diffuse ring in the fast Fourier transform in the inset.

