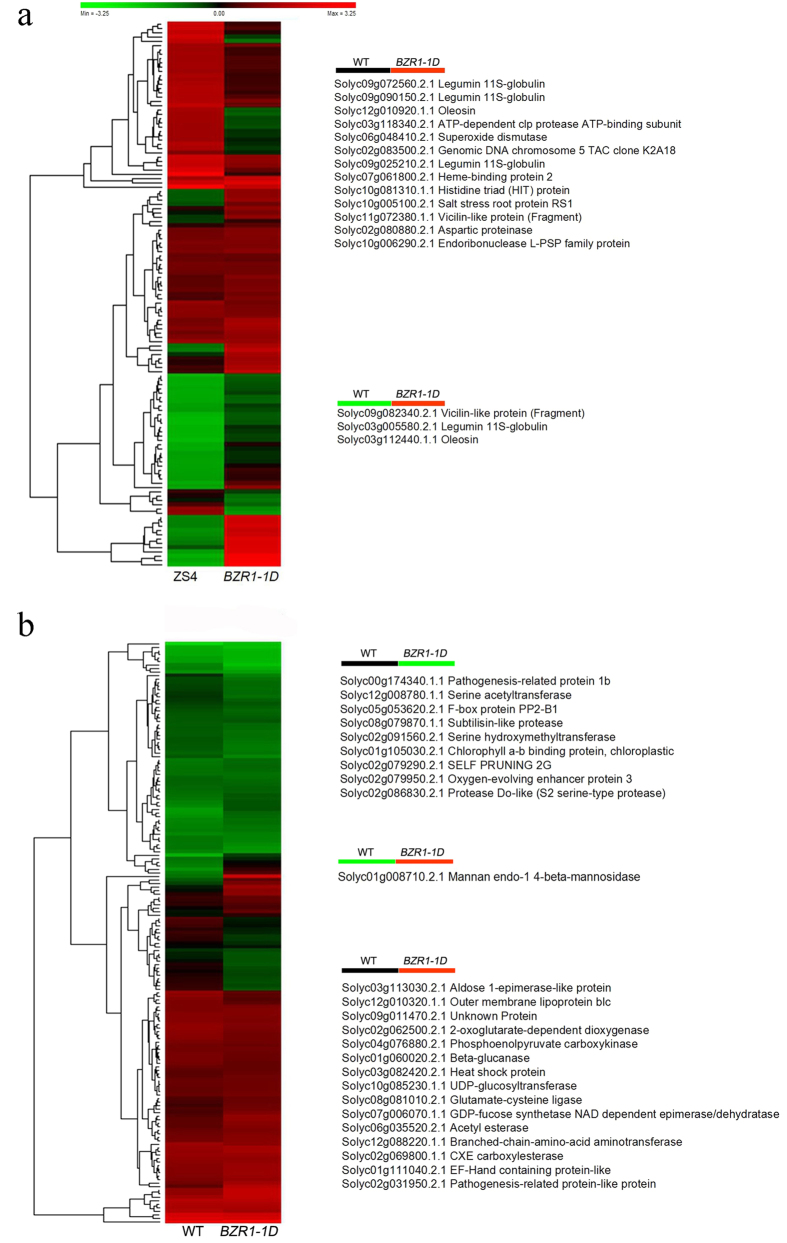
Figure 5.
The change tendency of proteins in BZR1-1D#23 and WT fruit during ripening stage converting from IM to MG (a) and B to R (b). The expression patterns of the proteins were hierarchically clustered based on the expression ratio as a log2 scale. Each row in the color heat map indicates a single protein. The green and red colors indicate down- and up-regulation, respectively.

