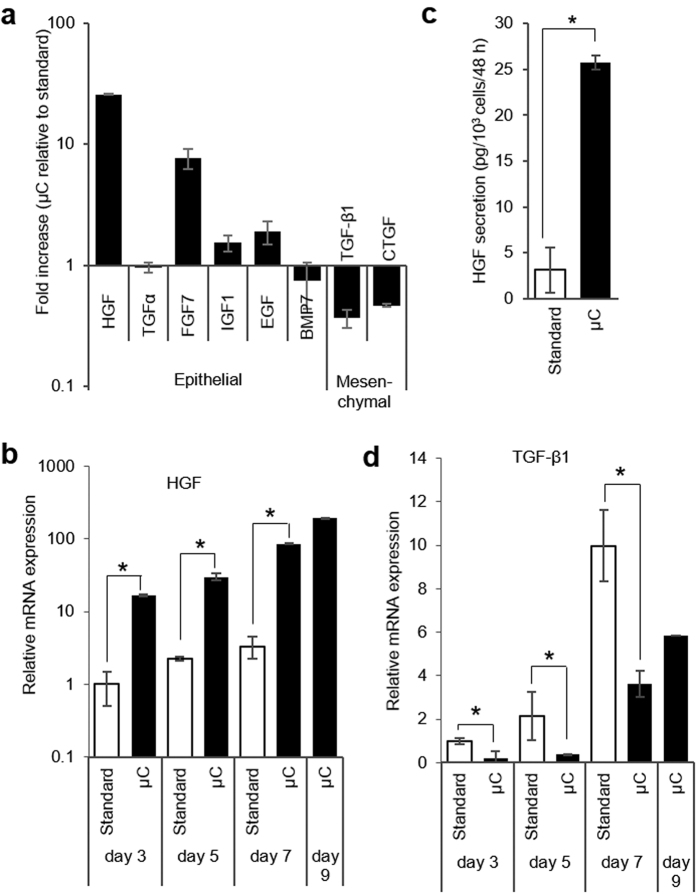
Figure 4. The expression of endogenous growth factors by primary hepatocytes is affected by small volumes of microchambers.
(a) Quantitative RT-PCR analysis of important liver-relate growth factors at day 7. Fold increase is relative to values obtained for hepatocytes cultured in standard tissue culture. (b) Quantitative RT-PCR analysis of HGF expression over 9 days of hepatocyte culture inside μCs and in 12-well plates. (c) HGF ELISA of hepatocyte cultured for 7 days μCs and in standard culture plates. (d) Quantitative RT-PCR analysis of TGF-β1 inside μCs and in 12-well plates. Data represent the average of 3 biological samples ± SD. *p < 0.05.

