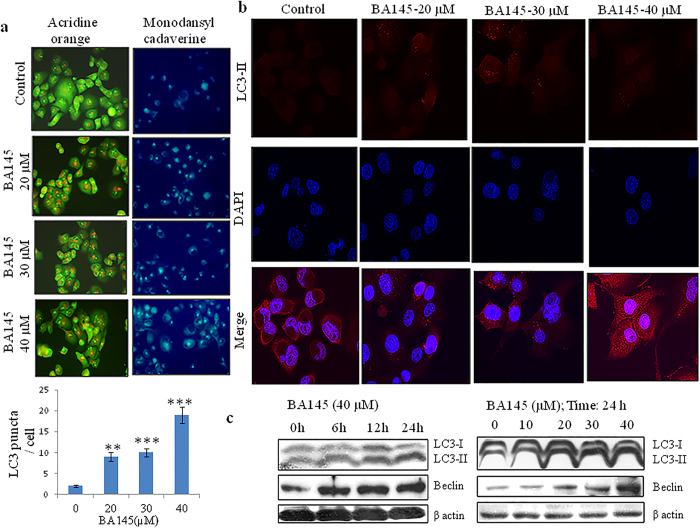
Figure 3. BA145 induces autophagy in PANC-1 cells.
BA145 treated cells (20, 30 and 40 μM concentrations; 24 h) were stained with acridine orange (1 μg/ml in serum free media for 10 min) and monodansylcadaverine (50 μM in complete media for 10 min) dyes and fluorescent micrographs were obtained by microscopy. In acridine orange staining, accumulation of acidic vesicular organelle is indicated by the increase in red fluorescence while the untreated control cells are green and in monodansylcadaverine staining, increase in blue florescence indicates acidic vesicle formation (b) Detection of autophagy marker LC3-II protein in BA145 treated PANC-1 cells for 24 h by immunofluorescent microscopy (c) Western blot analysis of the expression of LC3 and Beclin in BA145 treated PANC-1 cells at indicative concentrations and time intervals. Columns, mean; bars, SD with ***p < 0.001, **p < 0.01versus control.

