
Figure 1. Global hippocampal and cortical DNA hypomethylation and restoration of methylation levels with SAM administration in McGill-Thy1-APP Tg mice.
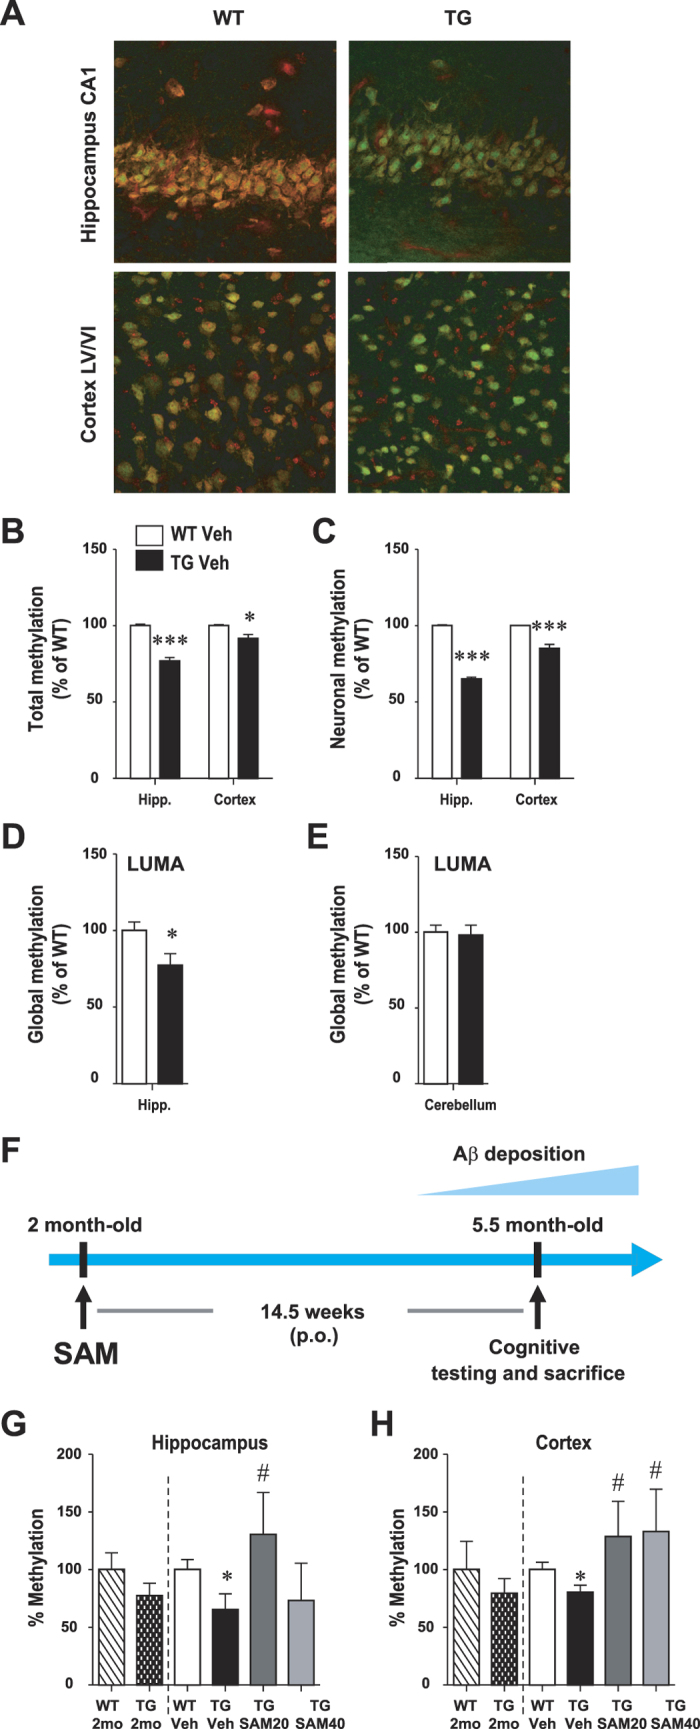
(A–C) 5-methylcytosine (5-mC) immunofluorescence. Representative images of the hippocampus (CA1 layer) and cerebral cortex (A) in 5 month-old animals showing 5-mC immunoreactivity (red labeling) and neuronal nuclei (NeuN, green labeling). Scale bar: 50 μm. (B,C) Quantification of the total (B) and neuronal (C) 5-mC relative fluorescence (red) in hippocampus and cortex (WT, n = 3; Tg, n = 3). Methylation is significantly decreased in Tg animals, particularly in the hippocampal neurons. (D,E) Global methylation levels in the hippocampus (D) and cerebellum (E) was measured using LUMA. Results are shown as methylation % relative to mean of WT, mean ± SEM. Student’s t-test, *P < 0.05, ***P < 0.001. (F) Experimental design of chronic SAM administration. (G,H) Global methylation was measured by ELISA in the hippocampus (G) and cortex (H) at 2 months of age, time-point where SAM administration started, and at the end of the treatment. All values are presented as relative percentage compared to WT at 2 months of age (WT 2 mo). Data are expressed as mean ± SEM and analyzed with One-Way ANOVA, followed by Bonferroni post-hoc test; *p < 0.05 vs WT Veh; #p < 0.05 vs Tg Veh.