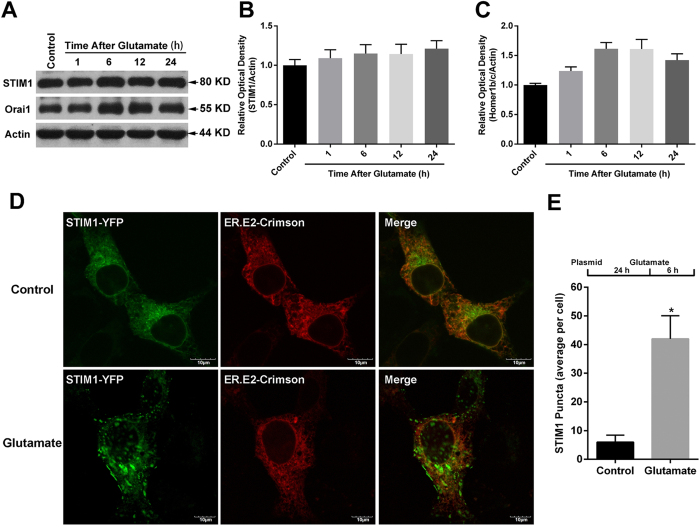
Figure 3. Glutamate induced the formation of STIM1 puncta in HT-22 cells.
Twenty-four h after seeding the cells into 60-mm plates, the HT-22 cells were exposed to glutamate (10 mM) for either 1, 6, 12 or 24 h. The protein levels of STIM1 and Orai1 were evaluated by western blotting (A). The relative expressions of STIM1 (B) and Orai1 (C) were calculated as percent of the optical density of the control group. After transfection with STIM1-YFP and ER.E2-Crimson constructs for 24 h and then exposure to glutamate (10 mM) for 6 h, the STIM1-YFP distribution was assessed via confocal microscopy; representative images are shown (D). Scale bar = 10 μM. The average STIM1-YFP puncta per cell was calculated (E). Approximately 30 to 35 cells were analyzed in each experiment. Data are presented as mean ± SEM from four experiments; *p < 0.05 vs. control group.

