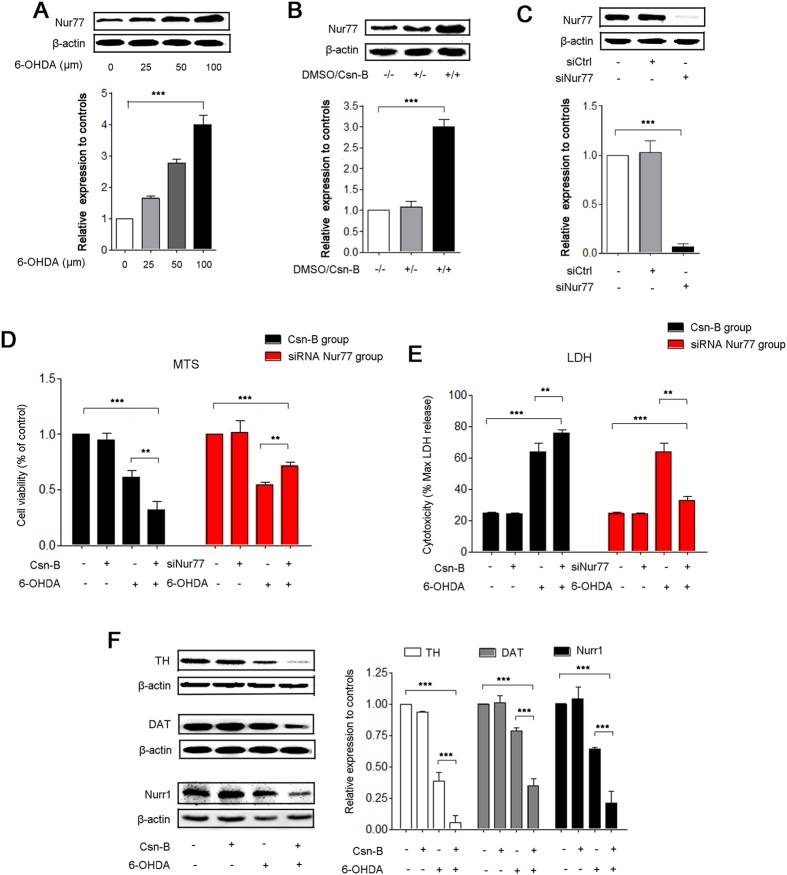
Figure 1. Nur77 exacerbated PC12 cell injury in 6-OHDA-lesioned model.
(A–C) Western blots analysis shows 6 -OHDA induces a concentration- dependent (0, 25, 50, 100 μM) increase in the expression of Nur77 in PC12 cells (A). Under treatment with 5 μg/ml Csn-B for 24 huors, Nur77 expression increases clearly (B). Transfection with siRNA targeting Nur77, Nur77 decreases sharply (C). The bar chart shows the relative quantification of Nur77 compared with that of β-actin (A–C). The data are expressed as the relative ratios of the control group, which was set to 1.0, and are expressed as the mean ± SEM of 5 independent experiments, ***p < 0.001. (D,E) Cell viability was measured using MTS assay (D). LDH leakage into the medium was measured using LDH assays (E). For agitated Nur77, PC12 cells were incubated with 100 μM 6-OHDA or 5 μg/ml Csn-B alone, or in combination with both 6-OHDA and Csn-B, and control vehicle was used as control. For knockdown of Nur77, PC12 cells were transfected by empty vector or siRNA targeting Nur77 with or without incubation with 100 μM 6-OHDA. The MTS data are expressed as the relative ratios of the control group, which was set to 1.0. The LDH data are expressed as the ratio of LDH release level to the maximal LDH release. Data are expressed as the mean ± SEM of 5 independent experiments, **p < 0.01, ***p < 0.001. (F) Western blots of TH, DAT, Nurr1 expressions in PC12 after treatment with 100 μM 6-OHDA or 5 μg/ml Csn-B alone, or in combination with both 6-OHDA and Csn-B, and control vehicle was used as control. The bar chart shows the relative quantification of proteins. The data are expressed as the mean ± SEM of 5 independent experiments, **p < 0.01, ***p < 0.001.

