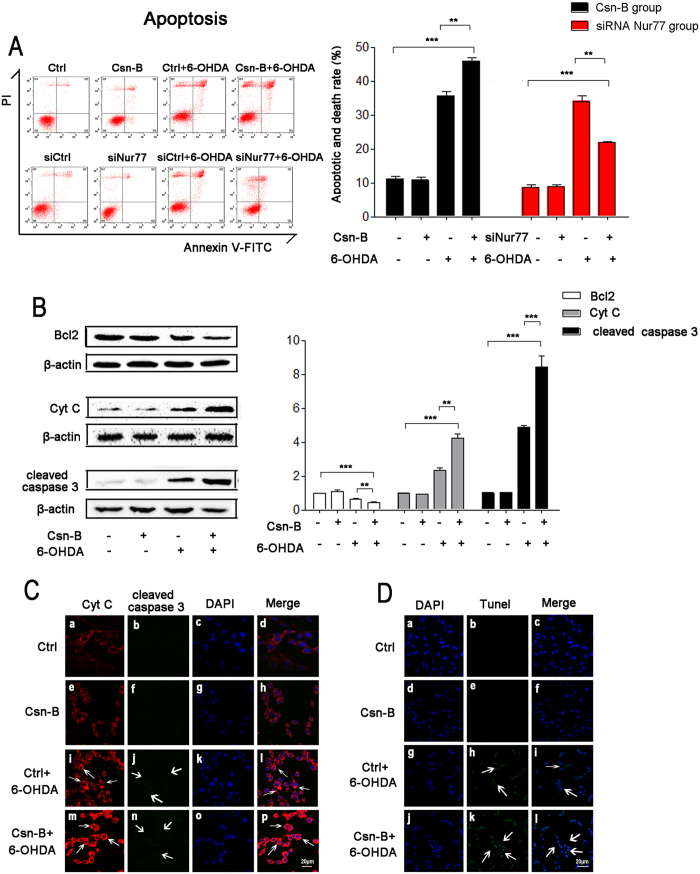
Figure 2. Nur77 induced cell apoptosis through Bcl2/Cytochrome C/Cleaved Caspase-3 pathway.
(A) Apoptosis was quantified by flow cytometry with double staining annexin V-FITC and PI. For agitated Nur77, PC12 cells were incubated with 100 μM 6-OHDA or 5 μg/ml Csn-B alone, or in combination with both 6-OHDA and Csn-B, and control vehicle was used as control. For knockdown Nur77, PC12 cells were transfected by empty vector or siRNA targeting Nur77 with or without incubation with 100 μM 6-OHDA. The bar chart shows the apoptotic rate of PC12 cells. The results are expressed as the mean ± SEM of 5 independent experiments, **p < 0.01, ***p < 0.001. (B) Western blots of Bcl2, Cytochrome C (Cyt C), cleaved caspase 3 expressions in PC12 after treatment with 100 μM 6-OHDA or 5 μg/ml Csn-B alone, or in combination with both 6-OHDA and Csn-B, and control vehicle was used as control. The bar chart shows the relative quantification of the protein levels compared with that of β-actin. The data are expressed as the relative ratios of the blank group, which was set to 1.0, and are expressed as the mean ± SEM of 5 independent experiments. **p < 0.01, ***p < 0.001. (C) Immunofluorescent staining with confocal microscopy of Cyt C (red fluorescence) and cleaved caspase 3 (green fluorescence) and DAPI (blue fluorescence) after treatment with 100 μM 6-OHDA or 5 μg/ml Csn-B alone, or in combination with both 6-OHDA and Csn-B, and control vehicle was used as control. Scale bar: 20 μm. (D) Immunofluorescent staining with confocal microscopy of Tunel (green fluorescence) and DAPI (blue fluorescence) after treatment with 100 μM 6-OHDA or 5 μg/ml Csn-B alone, or in combination with both 6-OHDA and Csn-B, and control vehicle was used as control. Scale bar: 20 μm.

