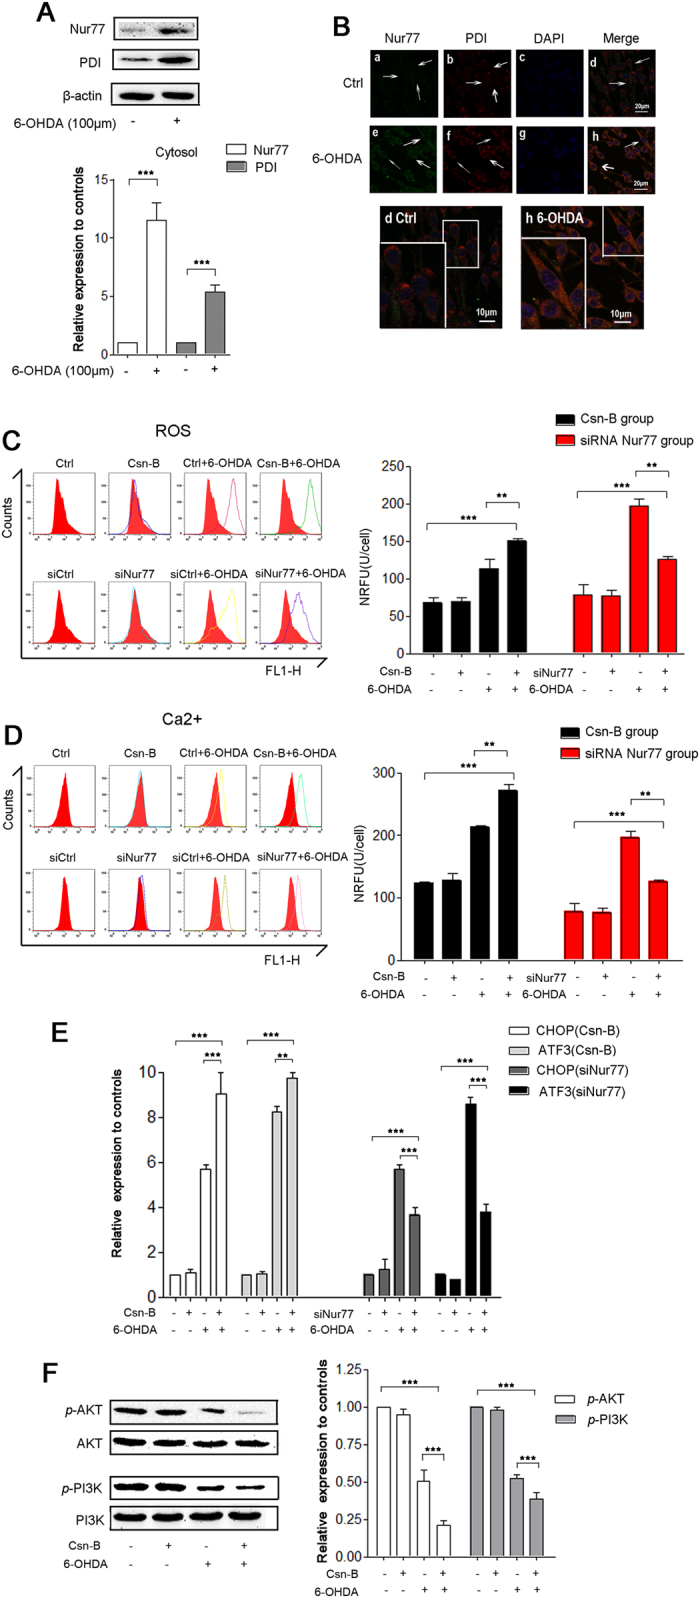
Figure 3. Nur77 regulated oxidative stress by increasing levels of ROS, Ca2+, CHOP and ATF3 mRNA.

(A) Western blots of Nur77 and PDI in ER after treatment with 100 μM 6-OHDA for 24 hours. The bar chart shows the relative quantification of Nur77 and PDI. (B) Immunofluorescent staining with confocal microscopy of Nur77 (green fluorescence) and PDI (red fluorescence) and DAPI (blue fluorescence) after treatment with 100 μM 6-OHDA for 24 hours. Scale bar: 20 μm. In the magnifying figures (d Ctrl group and h 6-OHDA group), the scale bar is 10 μm. (C–E) The ROS levels (C) and intracellular Ca2+ levels (D) were measured by flow cytometry. The mRNA expression of ER stress genes CHOP, ATF3 were assessed by quantitative real-time PCR in the PC12 cells after treatment (E). For agitated Nur77, PC12 cells were incubated with 100 μM 6-OHDA or 5 μg/ml Csn-B alone, or in combination with both 6-OHDA and Csn-B, and control vehicle was used as control. For knocking-down Nur77, PC12 cells were transfected by empty vector or siRNA targeting Nur77 with or without incubation with 100 μM 6-OHDA. The bar chart shows the ROS levels (C) and intracellular Ca2+ levels (D) as the average intensity of the recorded fluorescence (NRFU) per cell (U/cell). (F) Western blots of p-AKT, AKT, p-PI3K, PI3K expressions in PC12 after treatment with 100 μM 6-OHDA or 5 μg/ml Csn-B alone, or in combination with both 6-OHDA and Csn-B, and control vehicle was used as control. The bar charts show the relative quantification of p-AKT/AKT and p-PI3K/PI3K. All the data are expressed as the relative ratios of the blank group, which was set to 1.0, and are expressed as the mean ± SEM of 5 independent experiments, **p < 0.01, ***p < 0.001.
