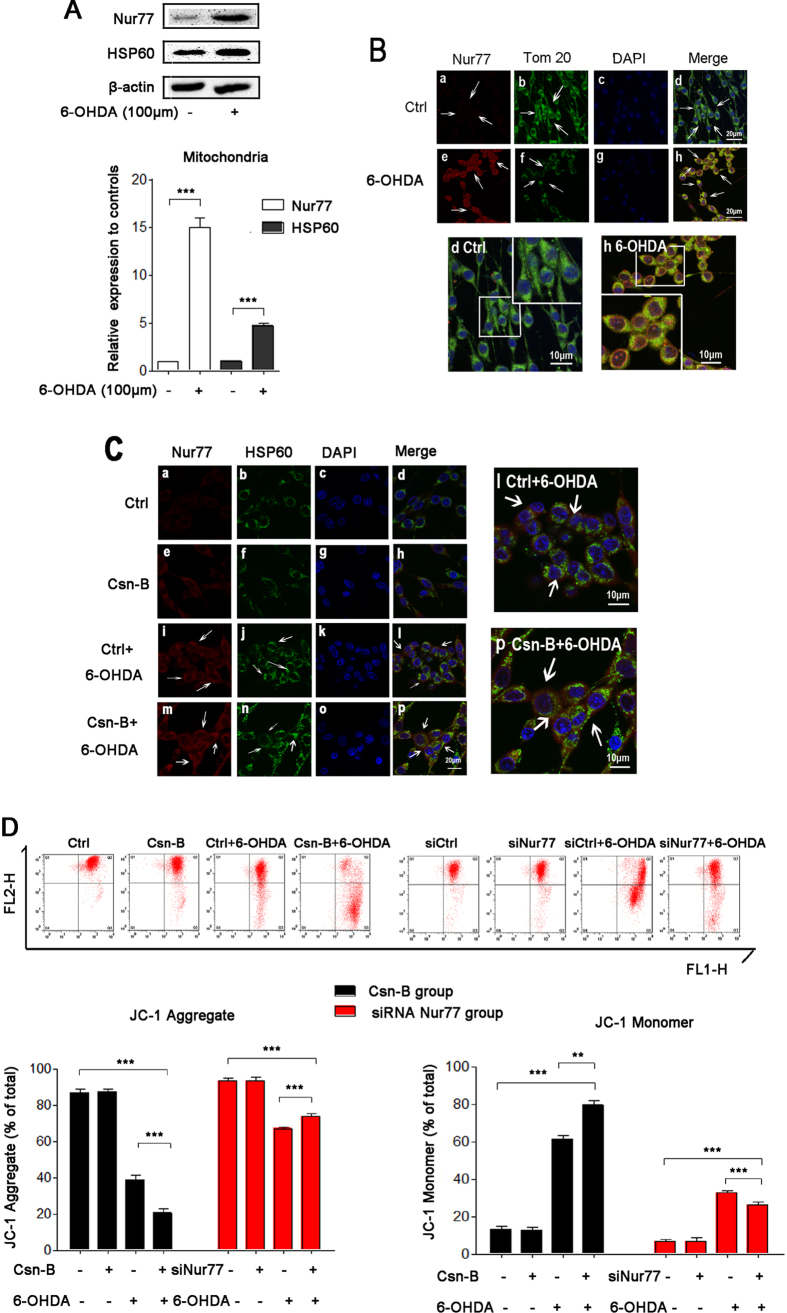
Figure 4. Nur77 induced PC12 cellular mitochondrial impairment.
(A) Western blots of Nur77 and HSP60 in mitochondria after treatment with 100 μM 6-OHDA for 24 hours. The bar chart shows the relative quantification of Nur77, ***p < 0.001. (B) Immunofluorescent staining with confocal microscopy of Nur77 (red fluorescence) and Tom20 (green fluorescence) and DAPI (blue fluorescence) after treatment with 100 μM 6-OHDA for 24 hours. Scale bar: 20 μm. In the magnifying figures (d Ctrl group and h 6-OHDA group), the scale bar is 10 μm. (C) Immunofluorescent staining with confocal microscopy of Nur77 (red fluorescence) and HSP60 (green fluorescence) and DAPI (blue fluorescence) after treatment with 100 μM 6-OHDA or 5 μg/ml Csn-B alone, or in combination with both 6-OHDA and Csn-B, and control vehicle was used as control. Scale bar: 20 μm. The scale bar is 10 μm in the magnifying figures (d Ctrl group and h 6-OHDA group). (D) The mitochondrial membrane potential (∆Ψm) was measured by flow cytometry with JC-1 assay. For agitated Nur77, PC12 cells were incubated with 100 μM 6-OHDA or 5 μg/ml Csn-B alone, or in combination with both 6-OHDA and Csn-B, and control vehicle was used as control. For knocking-down Nur77, PC12 cells were transfected by empty vector or siRNA targeting Nur77 with or without incubation with 100 μM 6-OHDA. The bar chart on the left shows the JC-Aggregate rate (the unhealthy cells rate) of total cells. The bar chart on the right shows the JC-Monomer rate (the healthy cells rate) of the total cells. The results are expressed as the mean ± SEM of 5 independent experiments, **p < 0.01, ***p < 0.001.

