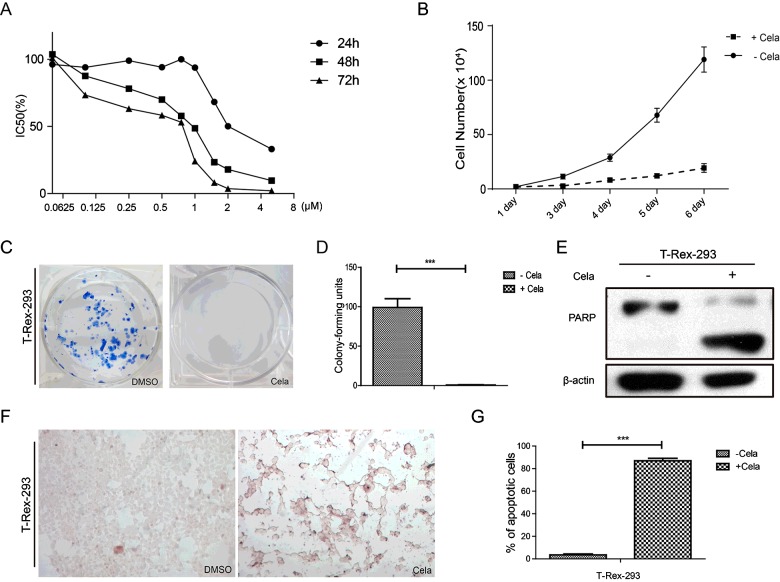
Figure 2. Celastrol suppressed cell growth and induced cell apoptosis in T-Rex-293 cells.
(A) Growth inhibition of T-Rex-293 cells treated with Celastrol at different concentration (0.25–5 μM) and different time-point (24, 48 and 72 h). (B) The cell growth curves of T-Rex-293 cells treated with or without Celastrol (0.5 μM 48 h). Cell numbers were counted as indicated. Results represent means±S.D. (n=3). (C) The colony formation of T-Rex-293 cells treated with or without Celastrol (0.5 μM 48 h). Eight hundred cells/well were seeded into six-well plates for 2 weeks. (D) The cell colony numbers of T-Rex-293 cells treated with or without Celastrol (0.5 μM 48 h) were analysed. Values are means±S.E.M. (n=3). ***P<0.001. (E) Western blot analysis of cleaved PARP in T-Rex-293 cells treated with or without Celastrol (0.5 μM) for 48 h. β-Actin was used as a loading control. (F) TUNEL assay was used to detect the apoptotic phenotype induced by Celastrol (0.5 μM 48 h). TUNEL-positive (apoptotic) cells were stained brown (magnification 100×). (G) The ratio of apoptosis cells was quantified. Values are means±S.E.M of three measurements in each group. ***P<0.001.

