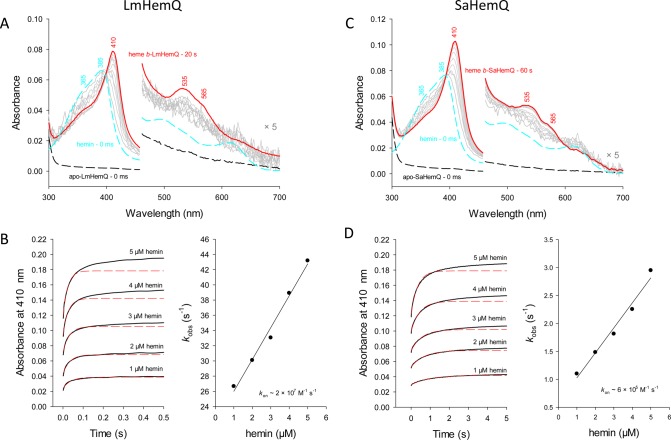
Figure 3.
Kinetics of binding of hemin to apo-HemQs from L. monocytogenes and S. aureus. (A) Spectral transitions upon binding of hemin to apo-LmHemQ. (C) Spectral transitions upon binding of hemin to apo-SaHemQ. (B and D) Time traces followed at 410 nm upon binding of hemin (0.25–1 μM) to 5 μM apo-LmHemQ or apo-SaHemQ: black lines for experimental time traces and red dashed lines for single-exponential fits of time traces. The right panels show plots of kobs vs ligand concentration.

