
Figure 5.
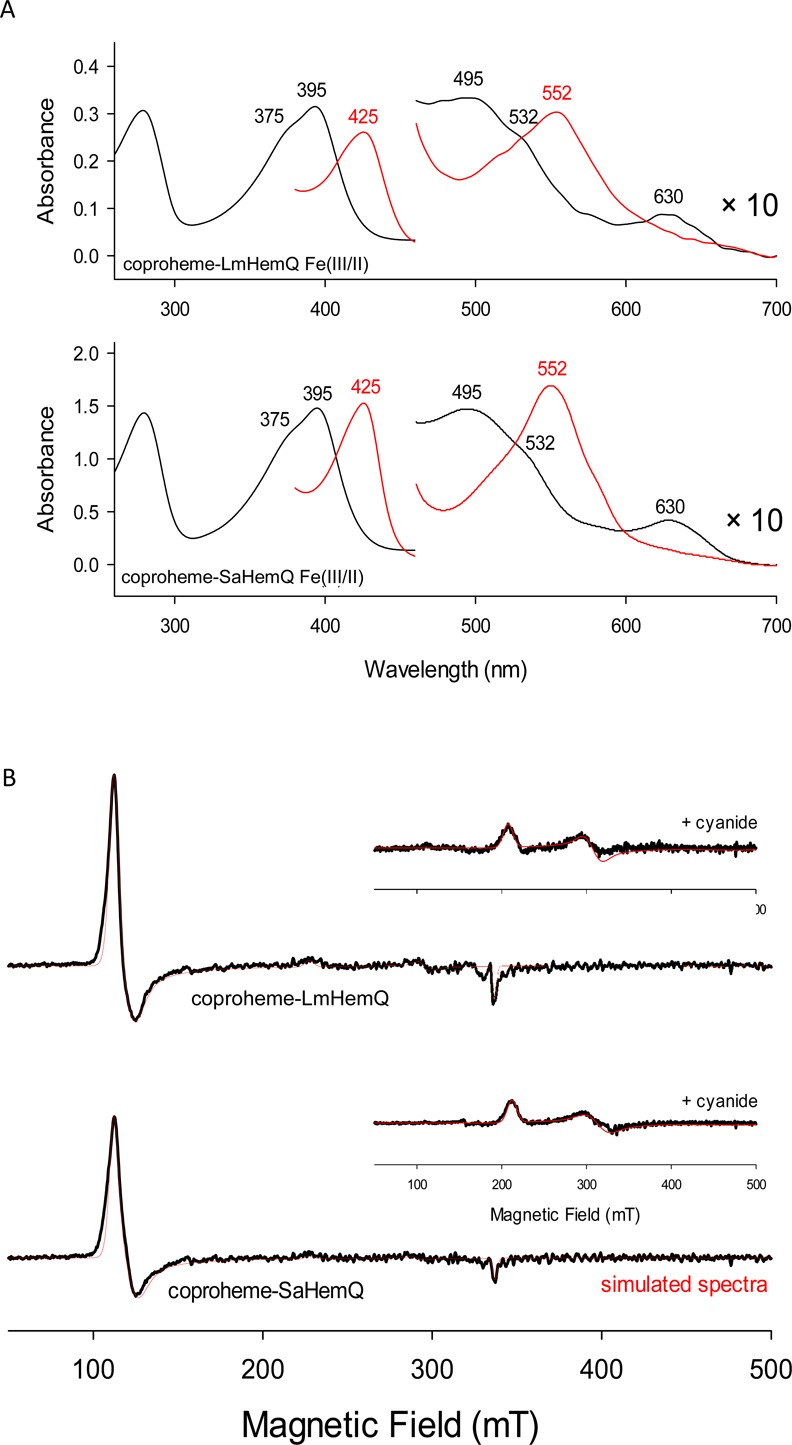
Spectral signatures of ferric and ferrous coproheme-HemQs. (A) UV–vis absorption spectra of LmHemQ and SaHemQ in their ferric (black line) and ferrous (red line) states. Conditions: 50 mM phosphate buffer (pH 7.0). (B) EPR spectra of 50 μM coproheme-LmHemQ and coproheme-SaHemQ. Experimental traces are shown as solid black lines, and simulated spectra (using EasySpin software) are shown as red lines. The inset depicts EPR spectra recorded in the presence of 1 mM cyanide. Conditions: 10 K and 200 mM phosphate buffer (pH 7.0).