
Figure 6.
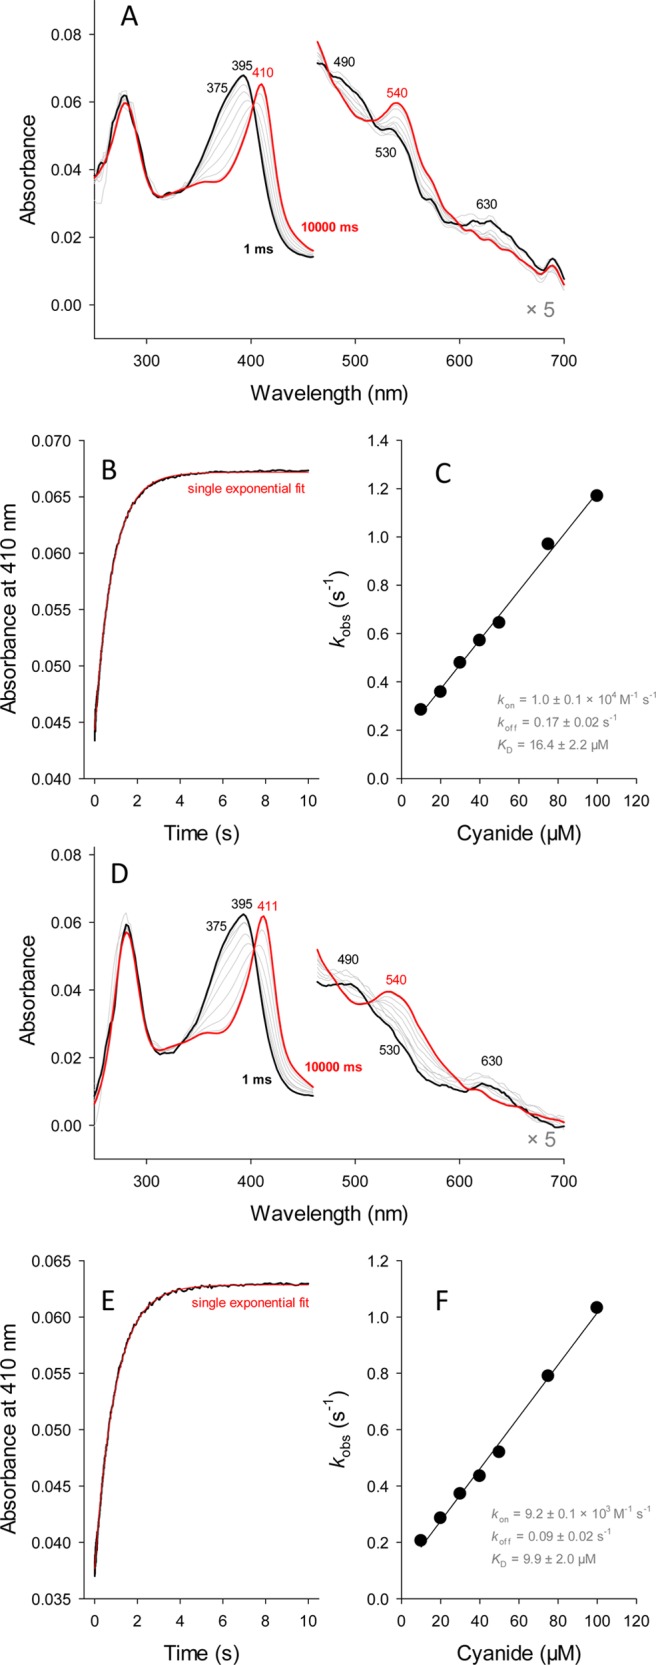
Kinetics and thermodynamics of binding of cyanide to coproheme-HemQs. Spectral changes upon reaction of 1 μM ferric coproheme-LmHemQ (A) and coproheme-SaHemQ (D) with 100 μM cyanide measured in the conventional stopped-flow mode. Typical time traces at 410 nm with a single-exponential fit for LmHemQ (B) and SaHemQ (E). Linear dependence of kobs values from the cyanide concentration for LmHemQ (C) and SaHemQ (F). Conditions: 50 mM phosphate buffer (pH 7.0).