
Figure 7.
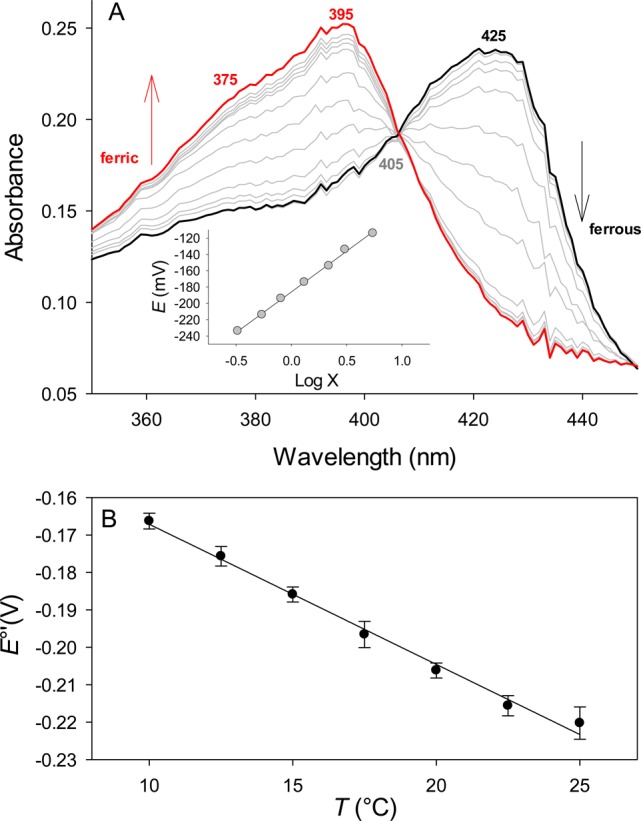
Spectroelectrochemistry and redox thermodynamics of coproheme-SaHemQ. (A) Data for ferrous SaHemQ (at −414 mV vs the SHE) are colored black and data for ferric SaHemQ (at −34 mV vs the SHE) red. Spectra recorded at various potentials between −414 and −34 mV vs the SHE are colored gray. The Nernst plot is shown as an inset, where log X is log[(A°425 – A425)/(A°395 – A395)]. (B) Redox thermodynamics of SaHemQ; temperature dependence of the reduction potential for SaHemQ. The slope of the plot yields ΔS°′/F. Solid lines are least-squares fits to the data points.