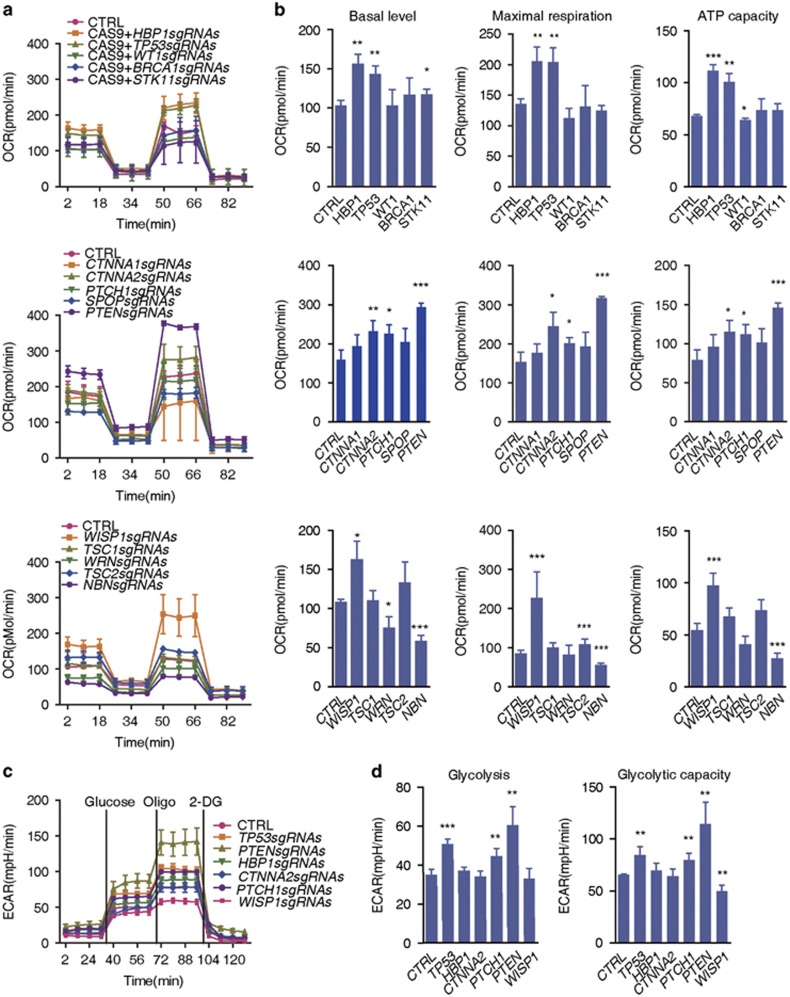
Figure 2.
Dynamic changes of mitochondrial bioenergetics after deletion of various tumor suppressor genes in human KGN Cells. (a) OCR levels were monitored using the Seahorse Bioscience Extra Cellular Flux Analyzer in real time. The Cell numbers were counted with Moxi Z cell counter (ORFLO, Ketchum, ID, USA), then 50 000 cells were seeded onto 24-well plates for XF24 in 250 μl of growth medium and incubated with 5% CO2 for 6–7 h (thereafter). The cells were sequentially treated as indicated with oligomycin (olig, 1 μM), p-trifluoromethoxy carbonyl cyanide phenyl hydrazone (FCCP, 0.5 μM), antimycin A (1 μM) and rotenone (rote, 1 μM). OCR, indicative of OXPHOS. Vertical lines indicate the time points for the administration of the corresponding inhibitors. All data were further normalized to the ratios of the indicated genotype to control (genomic ß-actin level using q-PCR) (thereafter) and were presented as the mean values±S.D., n=3 per group in the Seahorse experiments. (b) Histograms of the basal respiration, maximal respiration and the ATP capacity of KGN cells deficient in various tumor suppressor genes compared with the normal controls. The data are presented as the mean values±S.D., n=3 per group in the Seahorse experiments. *P<0.05, **P<0.01 and ***P<0.001. (c) ECAR levels were monitored using the Seahorse Bioscience Extra Cellular Flux Analyzer in real time in KGN cells. The cells were treated sequentially with glucose (100 mM), oligomycin (oligo, 1 μM) and 2-deoxyglucose (2-DG, 100 mM). (d) Basal levels and glycolytic capacity of ECAR were determined in KGN cells with different genotypes. Each column represents the mean values±S.D., n=3 per group in the Seahorse experiments

