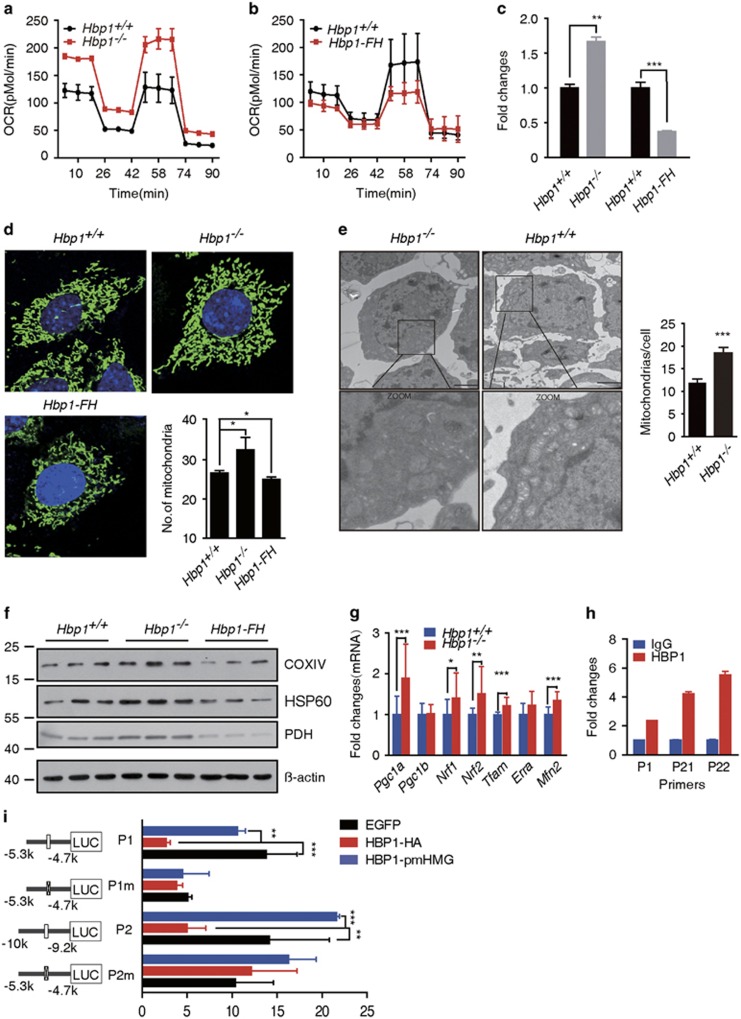
Figure 3.
Impacts of Hbp1 loss- or gain-of-function on mitochondrial respiration. (a) Genetic ablation of Hbp1 increased OCR levels in ovarian GCs. The cells were sequentially treated with oligomycin (1 μM), p-trifluoromethoxy carbonyl cyanide phenyl hydrazone (FCCP, 0.5 μM), antimycin A and rotenone (rote, 1 μM), and subsequently monitored using the Seahorse Bioscience Extracellular Flux Analyzer in real time. The data are presented as the mean values±S.D., n=3 per group in the Seahorse experiments from three independent experiments. (b) OCR levels decreased in Hbp1-FH GC, when monitored in real time using the Seahorse XFe24 as described above. All data are presented as the mean values±S.D., n=3 per group in the Seahorse experiments from three independent experiments. (c) mtDNA copy number increased in Hbp1−/− primary GCs, although decreased in Hbp1-FH mice. Genomic DNA (nuclear and mitochondrial) was isolated from ovaries with PMSG for 24 h. Q-PCR was performed to evaluate gene copy of CO1 (mitochondrial) and ß-globin (nuclear), and then the relative mtDNA copy number was shown by mtDNA/nuclear DNA. The data are presented as the mean values±S.D. (n=3), **P<0.01; ***P<0.001. (d) Mitochondrial morphology in the GCs was indicated using MitoTracker Geeen FM (Invitrogen, Waltham, MA, USA) and the cell nuclei were stained with DAPI after culture for 24 h in vitro. Mitochondrial numbers were averaged from >70 GCs per genotype. All data are presented as the mean values±S.D. (n=4), *P<0.05. (e) Ultrastructural features assessed through transmission electron microscopy in Hbp1+/+ and Hbp1−/− ovarian GCs. The boxed areas represent expanded regions (magnified) from panels of the selected region. Right panel showed statistical analysis from three independent experiments. Mitochondrial numbers were quantified in 10–15 cells from random fields. Each column represents mean values±S.D., ***P<0.001. Scale bar, 20 nm. (f) Western blot analysis of cytochrome c oxidase COXIV, pyruvate dehydrogenase (PDH) and heat-shock protein 60 (HBP60) in Hbp1+/+, Hbp1−/−and Hbp1-FH primary GCs (n=3). (g) Q-PCR results of genes related to mitochondrial biogenesis and function in Hbp1−/− ovaries compared with Hbp1+/+ (wild-type) ovaries at 2-month-old mice. The data are represented as mean values±S.D., n=14 for Hbp1−/− and Hbp1+/+ ovaries. *P<0.05, **P<0.01 and ***P<0.001. (h) Chromatin immunoprecipitation analysis showed Hbp1 binding to the Tfam promoter locus in the ovary. P1 is the primer pair for the first Hbp1 affinity sites, and P21 and P22 is the two pair primers for the second Hbp1 affinity site. Each column represents the mean values±S.D. (i) Luciferase assay results of Hbp1 modulation on Tfam promoter transcriptional repression in KGN cells. The indicated Tfam promoter-luciferase constructs were co-transfected with the wild-type Hbp1 (HBP1-HA) or mutant Hbp1 (HBP1-pmHMG) cDNA. Each column represents the mean values±S.D., and the results are confirmed by three independent experiments. **P<0.01 and ***P<0.001. P1, first Hbp1 affinity site; P1m, deletion of P1 site; P2, distant Hbp1 affinity site; P2m, deletion of P2 site

