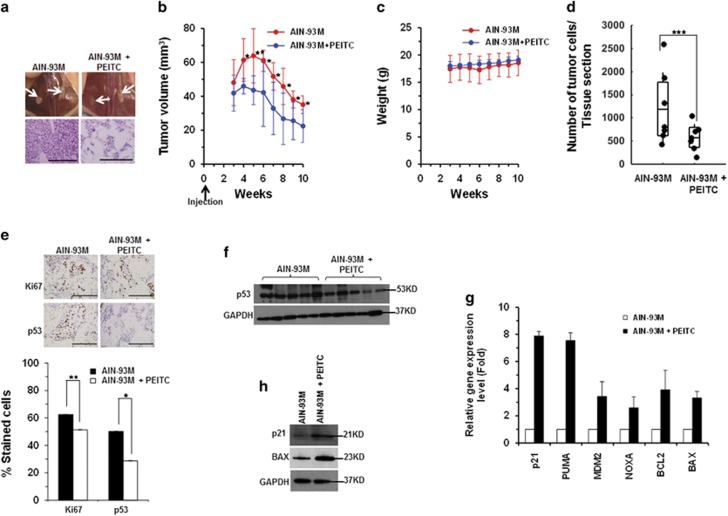
Figure 8.
PEITC induces p53R175H mutant reactivation in vivo and inhibits xenograft tumor growth. (a) Representative images of mouse mammary fat pads (upper panel), and H&E staining (lower panel). All scale bars represents a size of 200 μm. (b) Tumors were measured with Vernier calipers, and tumor volumes were calculated. Formula L × W2 × 0.523 (**P≤0.009 and *P≤0.03; n=7). (c) Animal weights (g) were measured weekly. (d) Distribution of the animals based on the average number of tumor cells per tissue section in the control and PEITC groups (***P≤0.00026; n=7). (e) Representative images of xenograft tumor tissue stained for Ki67 (**P≤0.007) and p53 (*P≤0.033) (upper panel) and quantitation of positive cells (lower panel) (n=7). Results are expressed as ±S.D. All scale bars represents a size of 200 μm. (f) Western blotting analysis of p53 expression levels in the xenograft tumors from the PEITC and control animal groups. Blot is representative of the 12 tumor tissue lysates analyzed from each group. (g) qRT-PCR (n=4) of p53-regulated genes in the PEITC and control animal groups. (h) Western blotting of p21 and Bax expression in SK-BR-3 xenograft tumors in vivo

