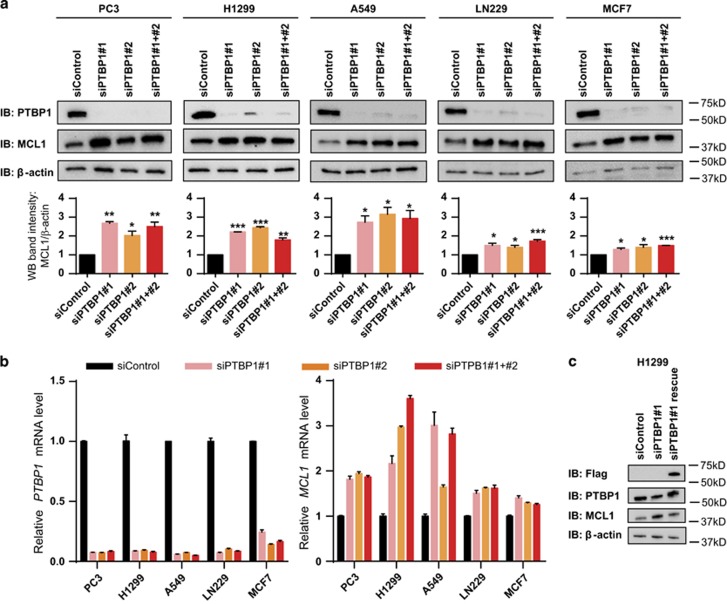
Figure 2.
Upregulation of MCL1 in response to PTBP1 knockdown. PC3, H1299, A549, LN229 and MCF7 cells were transfected with either negative control siRNA (siControl), one of two individual siRNAs targeting PTBP1 (siPTBP1#1 or siPTBP1#2) or a mixture of both siPTBP1 for 48 h. (a) MCL1 protein level was detected by western blotting. Relative MCL1 band intensity was normalized to β-actin. (b) MCL1 and PTBP1– mRNA level was measured by RT-qPCR. Data was normalized against GAPDH. (c) H1299 cells were transfected with Flag-control vector or Flag-PTBP1 vector to rescue the upregulation of MCL1 by siPTBP1#1. Data are shown as mean±S.E.M., n=3 or more. The statistical significance was determined by unpaired student t-test where *P<0.05; **P<0.01; ***P<0.001

