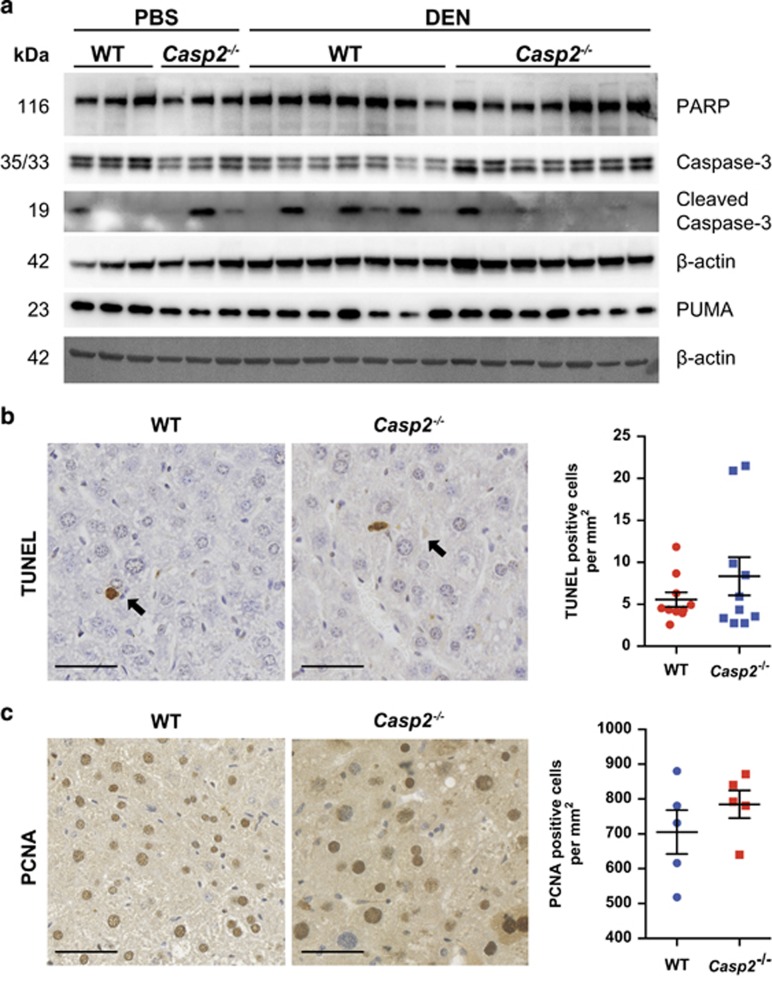
Figure 3.
Casp2−/− mice display no difference in cell death or proliferation. (a) Representative western blots showing increased caspase-3 cleavage in DEN-injected WT mice. (b) Representative images of TUNEL-positive cells in mice liver 10 months after PBS/DEN administration. Scale bar represents 50 μm. (c) Immunohistochemical staining for PCNA, as a marker of cell proliferation showing high frequency of PCNA-positive hepatocytes in brown, 10 months following DEN exposure. Scale bar represents 50 μm

