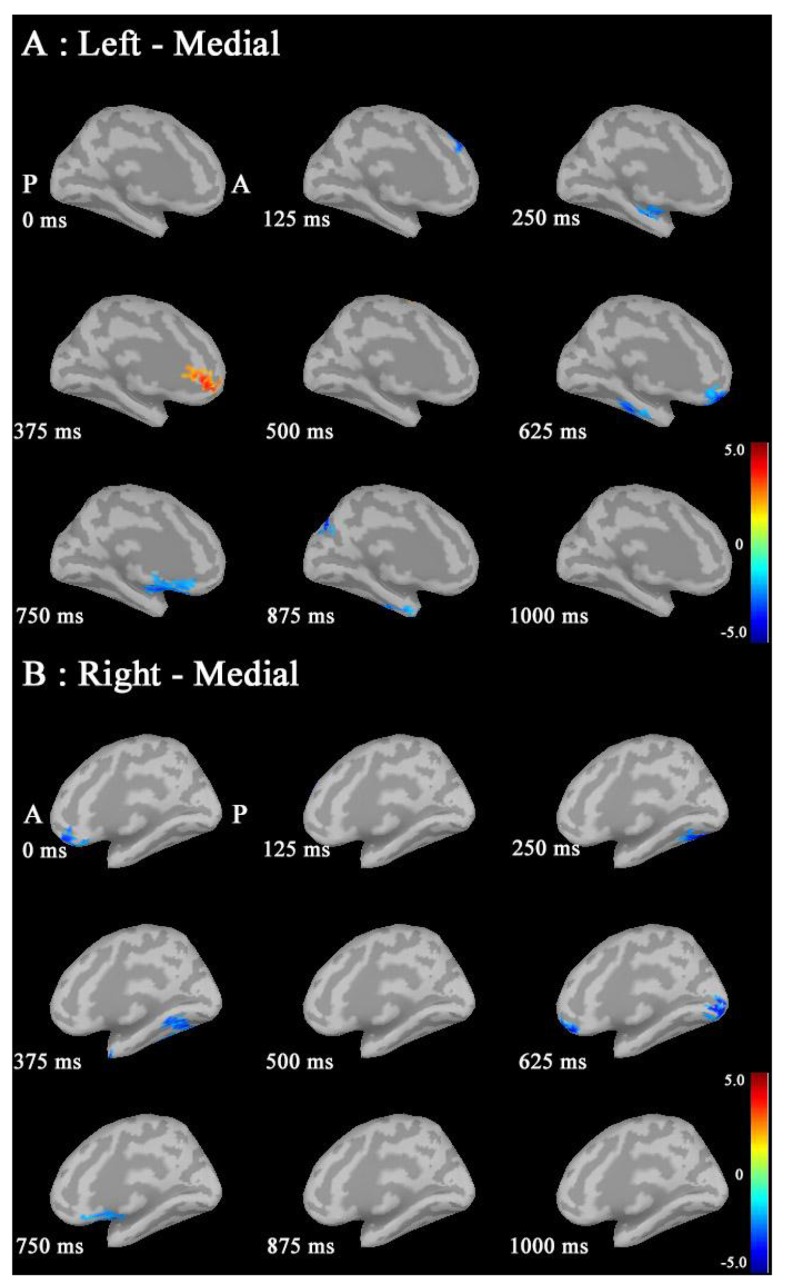
Fig. (4).
Statistical source maps of differences in t values (p<0.05) at 100-150 Hz. A: In the sagittal image in the left hemisphere, ERS in males was significantly increased in the rACC at 375 ms. ERD in males was significantly increased in small areas of the superior frontal, medial temporal, medial orbitofrontal, and inferior temporal regions and the precuneus during some reaction times. B: In the sagittal image in the right hemisphere, ERD in males was significantly increased in the medial orbitofrontal, fusiform, and occipital regions during some reaction time. (P: posterior, A: anterior, ERD: event-related desynchronization at some reaction time; ERS: event-related synchronization; rACC: rostral anterior cingulate cortex).

