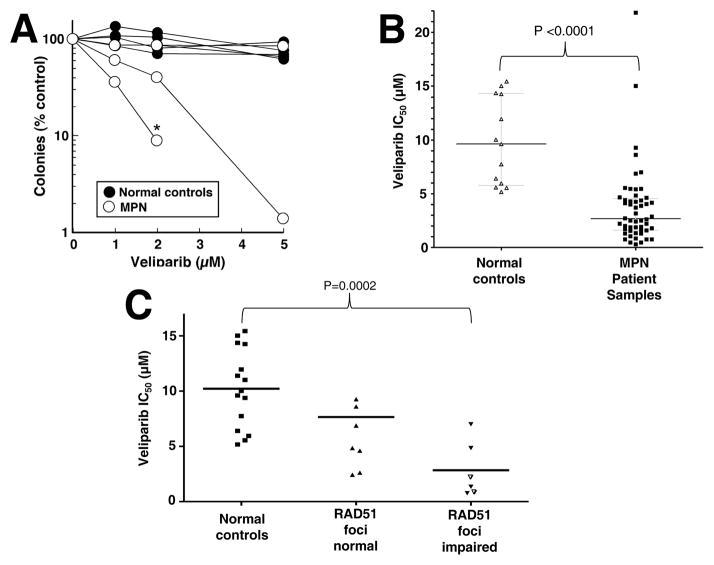
Figure 2. Veliparib sensitivity in MPN samples and normal controls.
A, results of colony forming assays in three MPN samples and four normal controls. Each line and corresponding symbols represent the mean results of replicate plates from one assay performed as described in the Methods. * indicates sample with no colony growth at the next higher veliparib concentration. B, summary of IC50 values in MPN samples and normal controls from results in panel A and additional samples run at veliparib concentrations up to 20 μM. C, relationship between IC50 values and formation of RAD51 foci in MPN samples. Open triangles represent samples with impaired formation of both phospho-H2AX and RAD51 foci (Table 1).

