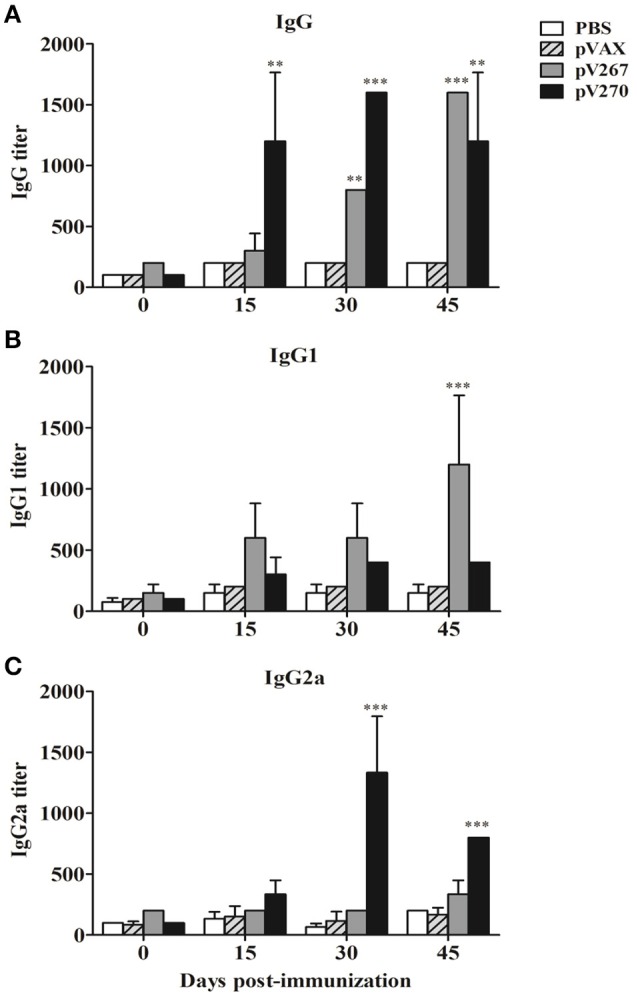
Figure 2.

Serum IgG (A), IgG1 (B), and IgG2a (C) titers measured by ELISA at day 0, 15, 30, and 45 post-immunization (n = 5). Results were expressed as mean ± standard deviation (SD) of the last serum dilution yielding a specific optical density higher than the cutoff value. **P < 0.01 and ***P < 0.001.
