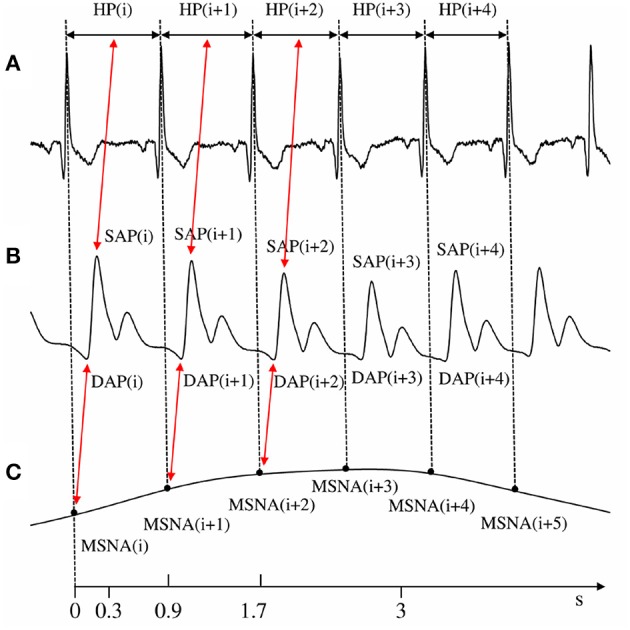
Figure 2.

The conventions for the construction of HP, SAP, DAP, and MSNA variability series from ECG (A), AP (B), and low-pass burst-count MSNA (C) are shown. The associations between HP and SAP values, exploited for the computation of cBRSSEQ and between MSNA variability and DAP utilized for the computation of sBRSSEQ, are reported as well. The time axis reports the lower and upper limits of the cBR and sBR latencies (i.e., 0.3–3.0 s and 0.9–1.7 s, respectively) assumed in this study.
